image source phys.org
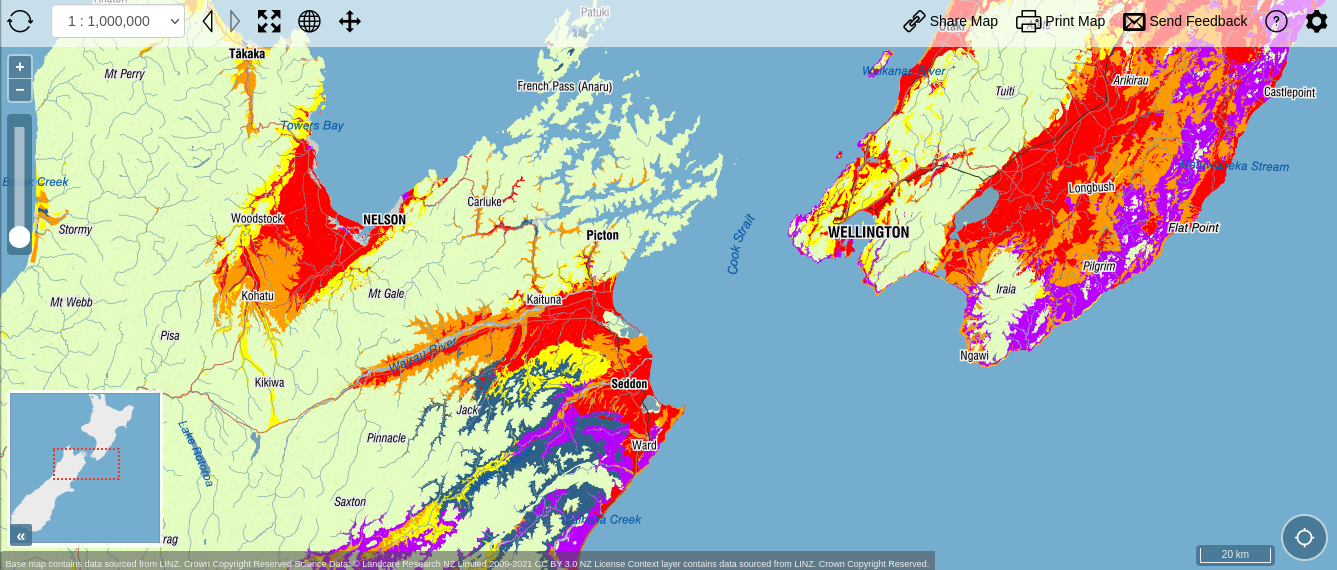
Land Environments of New Zealand (LENZ)

All the details are online see in particular

Technical Guide

Data

Input data

Fifteen data layers for all of Aotearoa New Zealand

Layers relating to each of climate (7 layers), landform (1 layer) and soils (7 layers)

Layers recorded on common 25m and 100m grids for the whole country

2.7 million data points

Clustering procedure

Even today, clustering 2.7 million objects is a a lot

Two stage process:

  • Separate clustering of the North and South Islands, using a procedure something like DBSCAN
  • Hierarchical clustering of the resulting 772 clusters

Output

A hierarchy of clusters at different levels

The threatened environments classification

Geodemographics

source lucguillemot.com/bayareageodemo/

image source newsweek.com
by Kacper Pempel/Reuters

Commercial examples

Approach outlined is used by a number of marketing companies, such as

Experian offer Mosaic in many countries

Claritas offer Nielsen PRIZM

See Singleton AD and SE Spielman. 2013. The past, present, and future of geodemographic research in the United States and United Kingdom. The Professional Geographer 66(4):558-567.

source Experian—more recent brochures are difficult to find; this is the 2018 pamphlet

Applications

‘Targeting’ of:

Marketing by mail

Retail location decisions

Election campaign materials


Ironically, such methods may be more important in countries with stronger privacy protections

More open approaches

In UK particularly, interest in geodemographic methods for targeting public services

Open systems of classification developed using census data alone

Early example Open Area Classification (OAC) from 2001 Census, since enhanced and updated

Similar effort in US, see e.g., mangomap.com

Again, see Singleton and Spielman, 2013

A local example

DOTLovesData’s US

An open example

source mapmaker.cdrc.ac.uk