
image source boingboing.net
<-
            x <- 4
            y <- 5.2
            z <- "This is text"
            x <- 3
            y <- c(1, 45, 27.3, -123) # y is a vector of values
            z <- data.frame(a = 1:100,
                            b = rep(5,100),
                            c = runif(100)) # z is a dataframe
$ symbol
            names(z)
            z$a
            x ^ 2 # ^ raises to the power
            y ^ 2
            z ^ 2
            z$c ^ 2
            plot(x, x^2)
            plot(z)
            boxplot(z$c)
            hist(z$c)
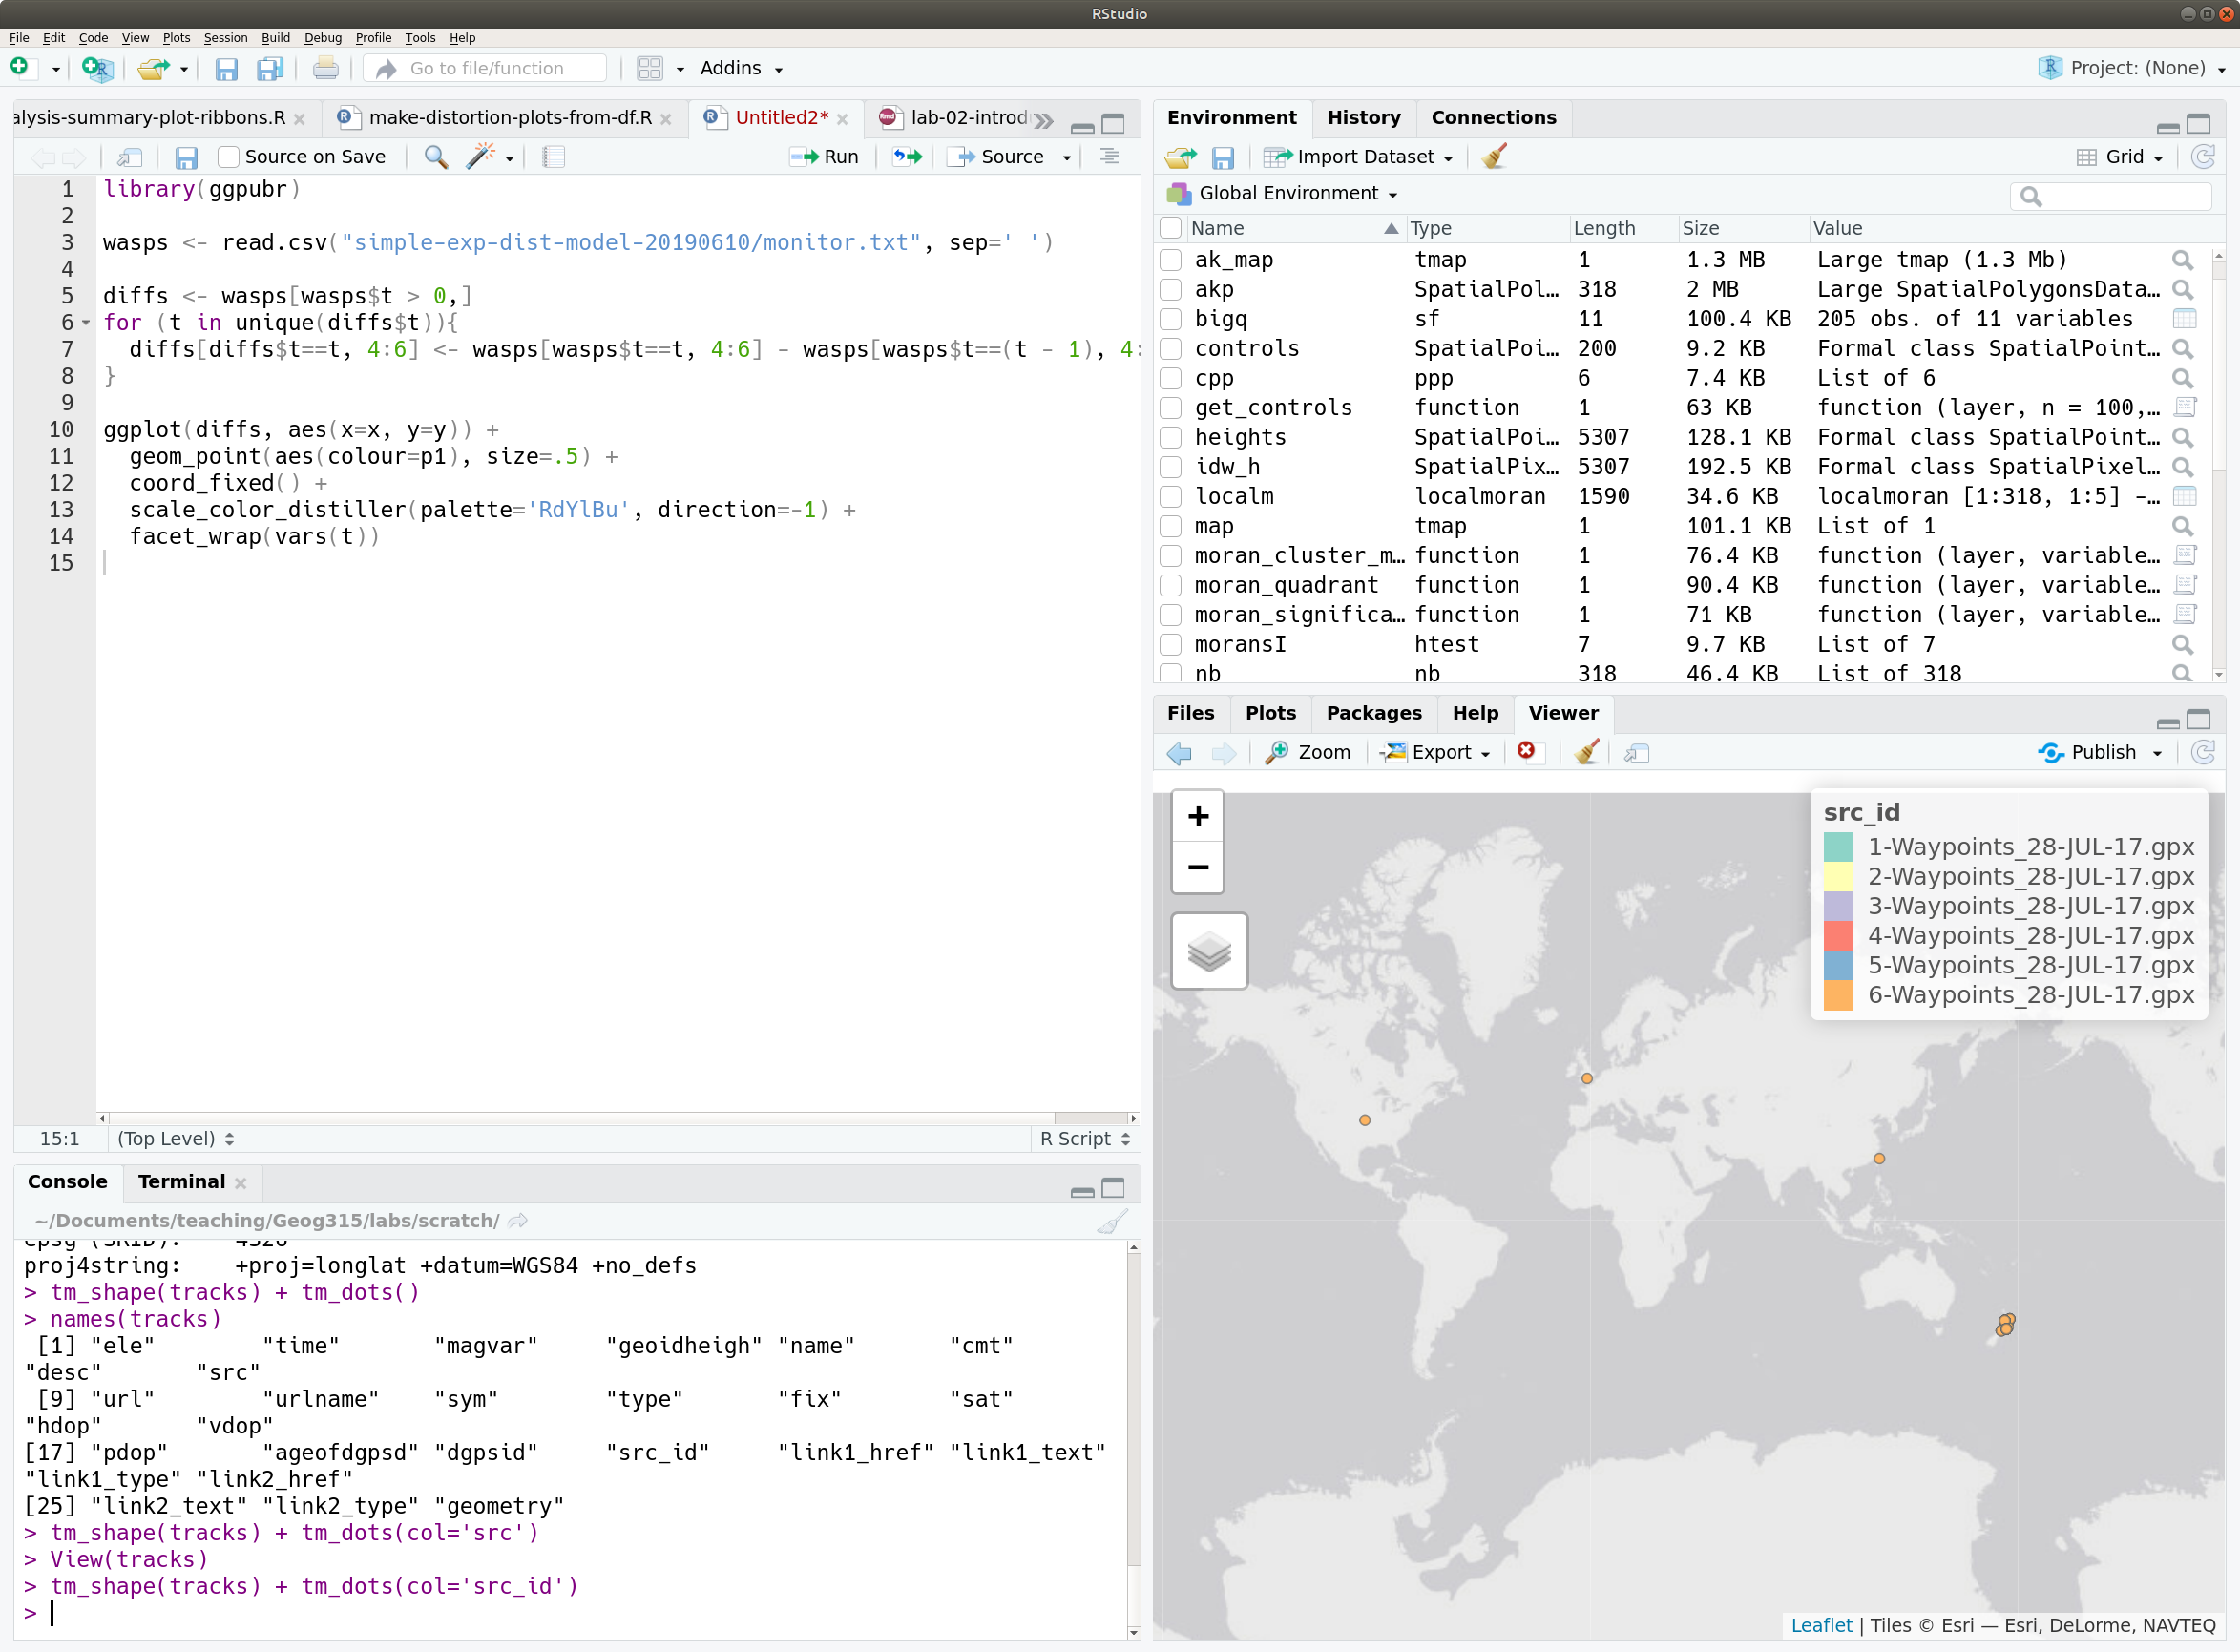
            library(sf)
            sf <- st_read("welly.gpkg")
            names(welly)
            plot(welly)

            library(tmap)
            tm_shape(welly) + tm_polygons()
            tm_shape(welly) + tm_polygons(col = "PopUR13")
sf and tmap packages will be focus of next couple of weeks on making maps in code