
Thunderstorms over South
Carolina seen from NASA’s
ER-2 aircraft at 19,800
metres during the Integrated
Precipitation and Hydrology
Experiment. source
commons.wikimedia.org
by
NASA on the commons
image Ian McHarg's Design with Nature 1969
source suzanneodonovan.wordpress.com
Libyan Sahara dune fields, image wikimedia.commons by David Stanley
spdep) > ArcGIS
spatstat) ≫ ArcGISimage source commons.wikimedia.org by Famartin

image source
commons.wikimedia.org
Adelie penguin colony, Cape Royds
Ross Island, Antarctica
image source
i.warosu.org
Namibian savannah

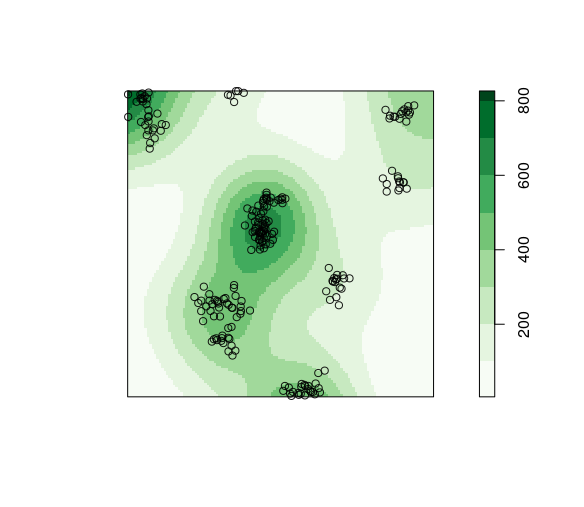
image source
independent.co.uk
Vinyl Junkies record store
Soho, London
Growth Pattern 19 by Paul Merryman
Output from the SYMAP system
source krygier.owu.edu
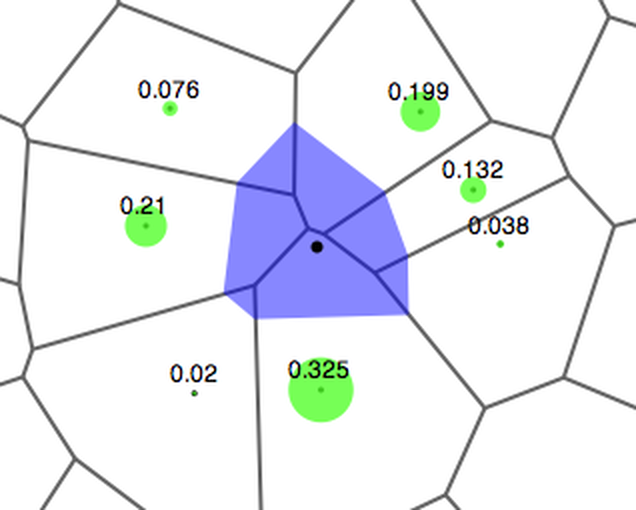
image source
openflights.org
source: Bunge W. 1962. Theoretical Geography. Gleerup, Lund, Sweden.
image source diagrams.org
© Transport for London
Orange cranberry cake by Helen Fletcher on flickr.com