Overall model structure
MtM ABM description
The model interface
The easiest place to start is with an overview of what the model looks like. At time of writing (mid-Feb 2025) the GUI appears as below (click on the image for a closer look):
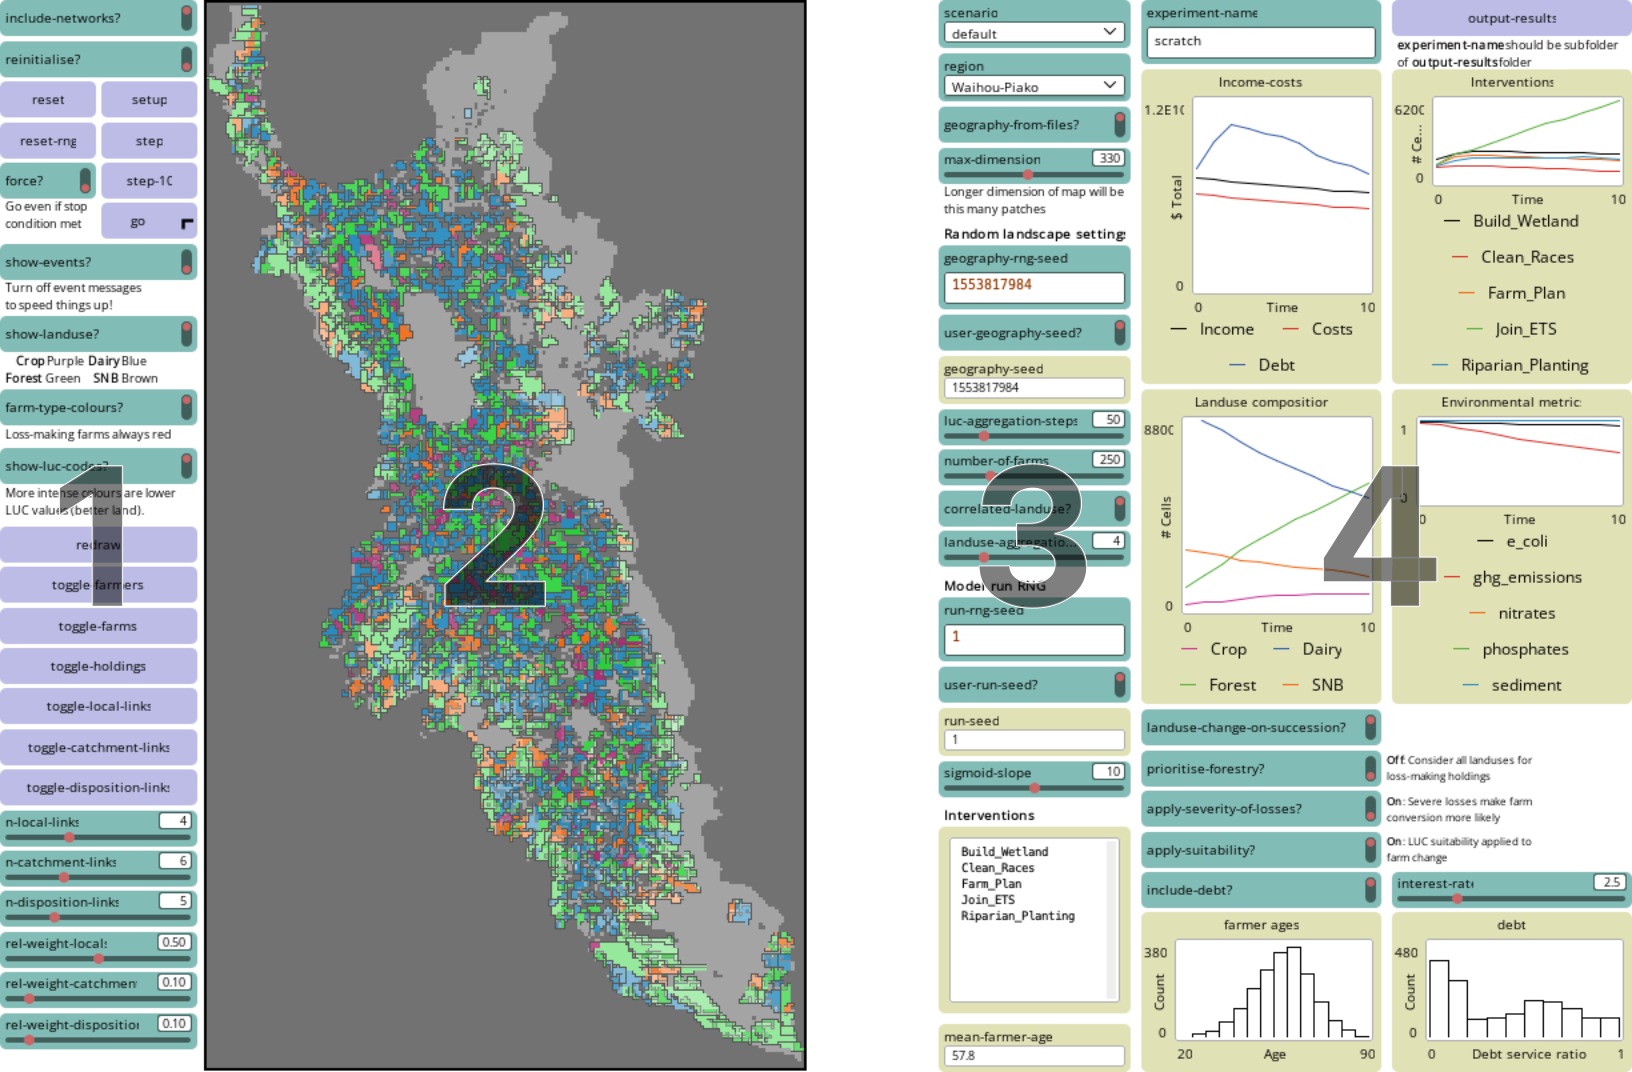
Column 1
Controls on the left-hand side are primarily starting and running the model and controlling display of visual elements.
Column 2
The map area shows land use capability (LUC; more intense colours are better land) and land use according to the following key:
- Greens Forest
- Blues Dairy
- Oranges Sheep and beef (SNB)
- Purples Crops
Farms are delineated in black and their current profit is shown by a circle scaled by the level of profit. If ‘in the black’ the circle is coloured to match dominant land use on the farm. If the farm is losing money (‘in the red’) the circle is coloured red.
Holdings are delineated in grey and shown by squares scaled and coloured in the same way as farms.
Farmers are shown as ‘person’ icons, with no additional information symbolised.
Column 3
Controls immediately to the right of the map area mostly affect model initialisation, in particular (i) allowing choice between a random map (shown above), and initialisation from GIS data (at right), and (ii) allowing for initialisation from controlled :random number seeds to allow for repeatability of results and exploration of the details of any findings. Two important settings are controlled by ‘sliders’:
sigmoid-slope
controls the rate of change of probabilities of adoption of intervention in response to push and pull factors. This is uncalibrated at present. A potential extension of the model would allow different levels of this control for different ‘nudge’ or market effects.carbon-price
the model carbon price (which impacts calculation of farm costs)
Column 4
The column of controls on the right of the model provides some tracking plots (farmer ages, overall land on which different interventions have been adopted, and overall land in different land uses), and also some high level controls as follows:
consider-landuse-change-on-succession
: If On when a farmer is succeeded by a new entrant the new farmer considers a change in (all of farm) land use if any of the farm’s holdings are losing money.prioritise-forestry-set-aside
: If On when a holding is unprofitable only forestry is considered as new land use; other land uses are also considered if this option is Off.- apply-severity-of-losses`: If On losses occurring across more of the farm (by area) make whole of farm conversion of land use less unlikely.
- apply-suitability`: If On suitability of LUC of holdings is taken into account when land use change is undertaken; if Off land use change disregards LUC.
region
: Specifiesdata/spatial
subfolder of GIS input filesscenario
: Specifiesdata/market
subfolder of market input files
Model elements
Clearly, there is a lot going on here. The easiest way to get a handle on it is through the main model elements and their attributes and behaviours.
Land use
Each unit of land in the model, and the aggregations into holdings or farms has a land use, which is one of "Crop"
, "Dairy"
, "Forest"
, or "SNB"
. This classification could be made more detailed, although some work would be required on visualization aspects of the model to accommodate the change. Note: Applied to grid cells representing the land in the model, land use is the landuse
attribute. Applied to farmers, farms, or holdings it is farm-type
.1 For holdings the two will always match exactly (all cells in a holding will be the same land use), but for farmers and farms not all associated cells need be in the same land use.
The farm-type
of a farm affects the propensity of a farmer to adopt various interventions, costs, yields, and emissions.
Management interventions
A list of potential management interventions, such as e.g., "Build_Wetland"
, "Clean_Races"
, "Farm_Plan"
, "Join_ETS"
, or "Riparian_Planting"
. These have associated impacts on costs, yields and emissions as set out in the intervention-impacts.csv
file.
The land
The land is represented by a square grid of cells (in NetLogo terminology ‘patches’). Each grid cell represents a notional 1 hectare, although the model’s spatial and temporal scales remain a little fuzzy at present. Each cell ‘knows’ its owning farmer and the holding and farm of which it is a part, although this information at the grid cell level is mostly used during model initialisation. Each cell also has a landuse
attribute which is one of the land uses represented, and a luc-code
, an integer between 1 and 8 (inclusive). LUC affects what land uses are suited to that land and also impacts, costs, yields, and emissions.
Farmers
Farmers are the only decision-making agents in the model even as other model elements (farms and holdings) are coded as ‘agents’ (everything in NetLogo is an agent2).
Farmers have the following attributes:
farm-type
: one of the land uses in the model, i.e. one of"Crop"
,"Dairy"
,"Forest"
, or"SNB"
.my-farm
: this farmer’s farm.my-holdings
: this farmer’s holdings.the-land
: a list of grid cells that compose the farm.age
: age in years. Affects likelihood of farmer leaving and being succeeded by a new farmer. See Farmer aging and succession.succession-stage
: how many ‘new farmers’ or ‘which generation’ of farmer this one is on this farm. We don’t spawn new farmers on succession, we just change their settings and increment this attributedisposition
: one of"for-profit"
,"pro-social"
, or"pro-environmental"
. Not currently used.industry-links
andlocal-links
: other farmers connected to this one, that might influence their decisions. The model machinery to enable this is present but not currently used.
Key actions run by farmers include:
age-and-succeed-farmer
: each model tick farmers age by one year, and with probability \frac{1}{91-\mathrm{age}} exit the industry and are replaced by a new farmer that may be of differentdisposition
, a differentage
(not necessarily younger, but probably), and if any holdings are currently loss-making will consider all of farm land use change. See Farmer aging and succession for details.consider-farm-type-change
andconsider-holdings-farm-type-change
: as detailed in Farmer decisions about land use farmers may decide to change the land use of a whole farm, or change the land use of individual holdings.make-farm-type-changes
: if a decision is taken to change land use on a farm or any of its holdings the farmer coordinates necessary updates to the model state.consider-management-changes
andmake-management-changes
: consider possible management interventions for adoption and implement them (or not) as detailed in Farmer decisions about management interventions.
Farms
Farms don’t do much of anything since holdings were added to the model. This is reflected in the fact that their only attributes are the self-explanatory the-land
, farm-type
, and my-farmer
. A potential extension of the model (part implemented) records the losses-record
of a farm and this impacts the willingness of farmer’s to consider land use change, so that an all-of-farm change in land use would become more likely as losses persist over time.
Holdings
Holdings are subfarm level units at which management interventions and land use changes are implemented.
Holdings have the following attributes:
farm-type
: one of the land uses in the model, i.e. one of"Crop"
,"Dairy"
,"Forest"
, or"SNB"
.my-farmer
: the farmer who owns this holding.my-farm
: the farm of which this holding is a part.the-land
: a list of grid cells that compose the holding.landuse-luc-profile
: a cross tabulation of the number of grid cells (i.e., hectares) of land in the holding by land use and LUC. In the current implementation since holdings are defined by land use and LUC only one entry in the table will be non-zero! However, as detailed in Calculation of holding income this allows (if desired) for extension to more complex holding structures—most likely with a range of LUC across a holding. A farmer can sum these matrices to get a picture of the overall composition of their farm.current-profit
,current-income
, andcurrent-costs
: profit, income, and costs of the holding as detailed in Calculation of holding income.my-mgmt-interventions
: a list of boolean flags indicating which management interventions have been adopted on this holding.avail-mgmt-interventions
: a list of boolean flags indicating which management interventions remain available to this holding for possible adoption.
Key actions run by holdings (at the behest of farmers!) are:
holding-change-farm-type
andimplement-intervention
: bookkeeping functions to pass changes in land use down to grid cells and update the lists of adopted and available interventions.get-intervention-score
: scores interventions under consideration based on impact on costs and income as detailed in Farmer decisions about management interventions.get-holding-income
andget-holding-costs
: calculate holding income and costs as detailed in Calculation of holding incomeget-cost-after-intervention
,get-yield-after-intervention
, andget-emissions-after-intervention
: calculates what the income or yield or emissions of the holding would be if a specified intervention were to be implemented as part of the decision making process around management interventions, as detailed in Farmer decisions about management interventions.
Organisation of model files
Code
To make managing model source code a little easier it is broken into a main .nlogo
file and a number of NetLogo source .nls
files. Unfortunately the built in IDE for NetLogo is rather primitive, so this breakdown is not perfect, but it at least keeps the size of each source file manageable (a few hundred lines at most), where a monolithic flat file would be an unwieldy 2000+ lines. The files are as follows:
Filename | Purpose |
---|---|
abm-working.nlogo |
Definition of globals, setup and main model loop, model reset code |
mtm-read-files.nls |
Reading of market setting files into tables and conversion to matrices |
mtm-geography.nls |
Setup of model geography, whether from GIS files or random |
mtm-farmer.nls |
Initialisation and maintenance of farmer agents, primarily procedures for choosing among options for land use change / management interventions |
mtm-farm.nls |
Initialisation and maintenance of farm agents |
mtm-holding.nls |
Initialisation and maintence of holding agents, primarily calculation of income and costs |
mtm-plots.nls |
Plotting of some model statistics for interactive exploration |
mtm-render.nls |
Visual rendering of model state |
In addition the files list-utils.nls
, distribution-utils.nls
(both from my netlogo-utils project), and mtm-utils.nls
collect together a large number of utility functions of general use to all the other model components.
Data
A key idea underpinning model development was to avoid hard coding dozens, or even hundreds of settings into the model code. To that end a data
folder in the same directory as the model source code has subfolders market
and spatial
themselves with subfolders containing model input files that can specify scenarios whether catchment-based (the spatial
folder) or market-based (the market
folder).
Market
Each ./data/market/<scenario-name>
subfolder contains a collection of files that configure aspects of the market, which together form a scenario.
Filename | Purpose |
---|---|
farmer-threshold-matrix.csv |
Baseline probabilities of adoption by farmers of available management interventions by land use |
intervention-impacts.csv |
Impact on yields, costs, and emissions per ha. by management intervention and land use |
conversion-probabilities.csv |
Relative probability of conversion between the different land uses |
suitabilities.csv |
Binary (yes/no) suitability by land use capability for each land use |
input-costs.csv |
Mean and st dev. of costs per ha. of inputs by land use and land use capability |
commodity-yields.csv |
Mean and st dev. of yields (in appropriate units) per ha. of output by land use and land use capability |
prices.csv |
Market price (per unit of output) by land use |
ghg-emissions.csv |
Mean and st dev. of GHG emissions (in appropriate units) per ha. of output by land use and land use capability |
The first of these files (farmer-threshold-matrix.csv
) effectively defines the available land use types and interventions and additional rows or columns could be added to it to further detail the model’s representation. Note: Extending the model in this way to add interventions is trivial; adding additional land uses will require additional code to deal with visualisation aspects.
The first 4 files effectively define the decision space of farmers in the model. The latter 4 define the market constraints (costs, yields, prices, emissions).
Geographical setting
The geographical setting of the model can be initialised randomly or from GIS files (controlled by a switch in the model GUI).
Random initialisation first sets up a land use capability (LUC) landscape either using iterative smoothing3, or using a voter model4, then randomly distributes farmers across the landscape assigning them a farm based on Voronoi polygons5 and breaking the farm into sub-farm level holdings based on contiguouse areas of the same LUC.
Initialisation from GIS files uses a parcels.shp
shapefile and luc.asc
raster file to specify respectively the farms and LUC landscape of the model. Farms are again subdivided into holdings based on LUC. Different catchments can be applied by providing these files in a folder ./data/spatial/<region-name>
. Model development has been based on data for the Rangitaiki catchment to test this setup. Currently initialisation from files sets land use randomly (no such attribute is available in the parcels.shp
file), but we anticipate that ‘localisation’ of the model to particular catchments will be relatively straightforward given appropriate spatial data files.
Date | Changes |
---|---|
2025-02-19 | Initial post. |
Footnotes
The reason for this difference is an implementation detail in NetLogo. Agents (which farmers, farms, and holdings are) can always directly access attributes of the grid cells they are in. If the land use attribute had the same name both in grid cells and in the various agents, then accessing
landuse
would be ambiguous: does it refer to the agent’s attribute or the grid cell’s attribute? Naming the attribute differently resolves the ambiguity.↩︎Termed ‘turtles’ in NetLogo due to NetLogo’s origins in the Logo programming language which introduced ‘turtle graphics’. See Resnick M. 1994. Turtles, Termites, and Traffic Jams: Explorations in Massively Parallel Microworlds. Cambridge MA: MIT Press.↩︎
See pages 60-63 in O’Sullivan D and GLW Perry. 2013. Spatial Simulation: Exploring Pattern and Process. Chichester, UK: Wiley.↩︎
See pages 80-81 in O’Sullivan D and GLW Perry. 2013. Spatial Simulation: Exploring Pattern and Process. Chichester, UK: Wiley.↩︎
Okabe A, B Boots, K Sugihara, and SN Chiu. 2000. Spatial Tessellations: Concepts and Applications of Voronoi Diagrams. 2nd edn. Chichester, UK: Wiley.↩︎