This is an ongoing project in collaboration with Luke Bergmann at University of British Columbia.
The idea is to map many different variables by combining them by ‘weaving’ or ‘tiling’. Here’s an example
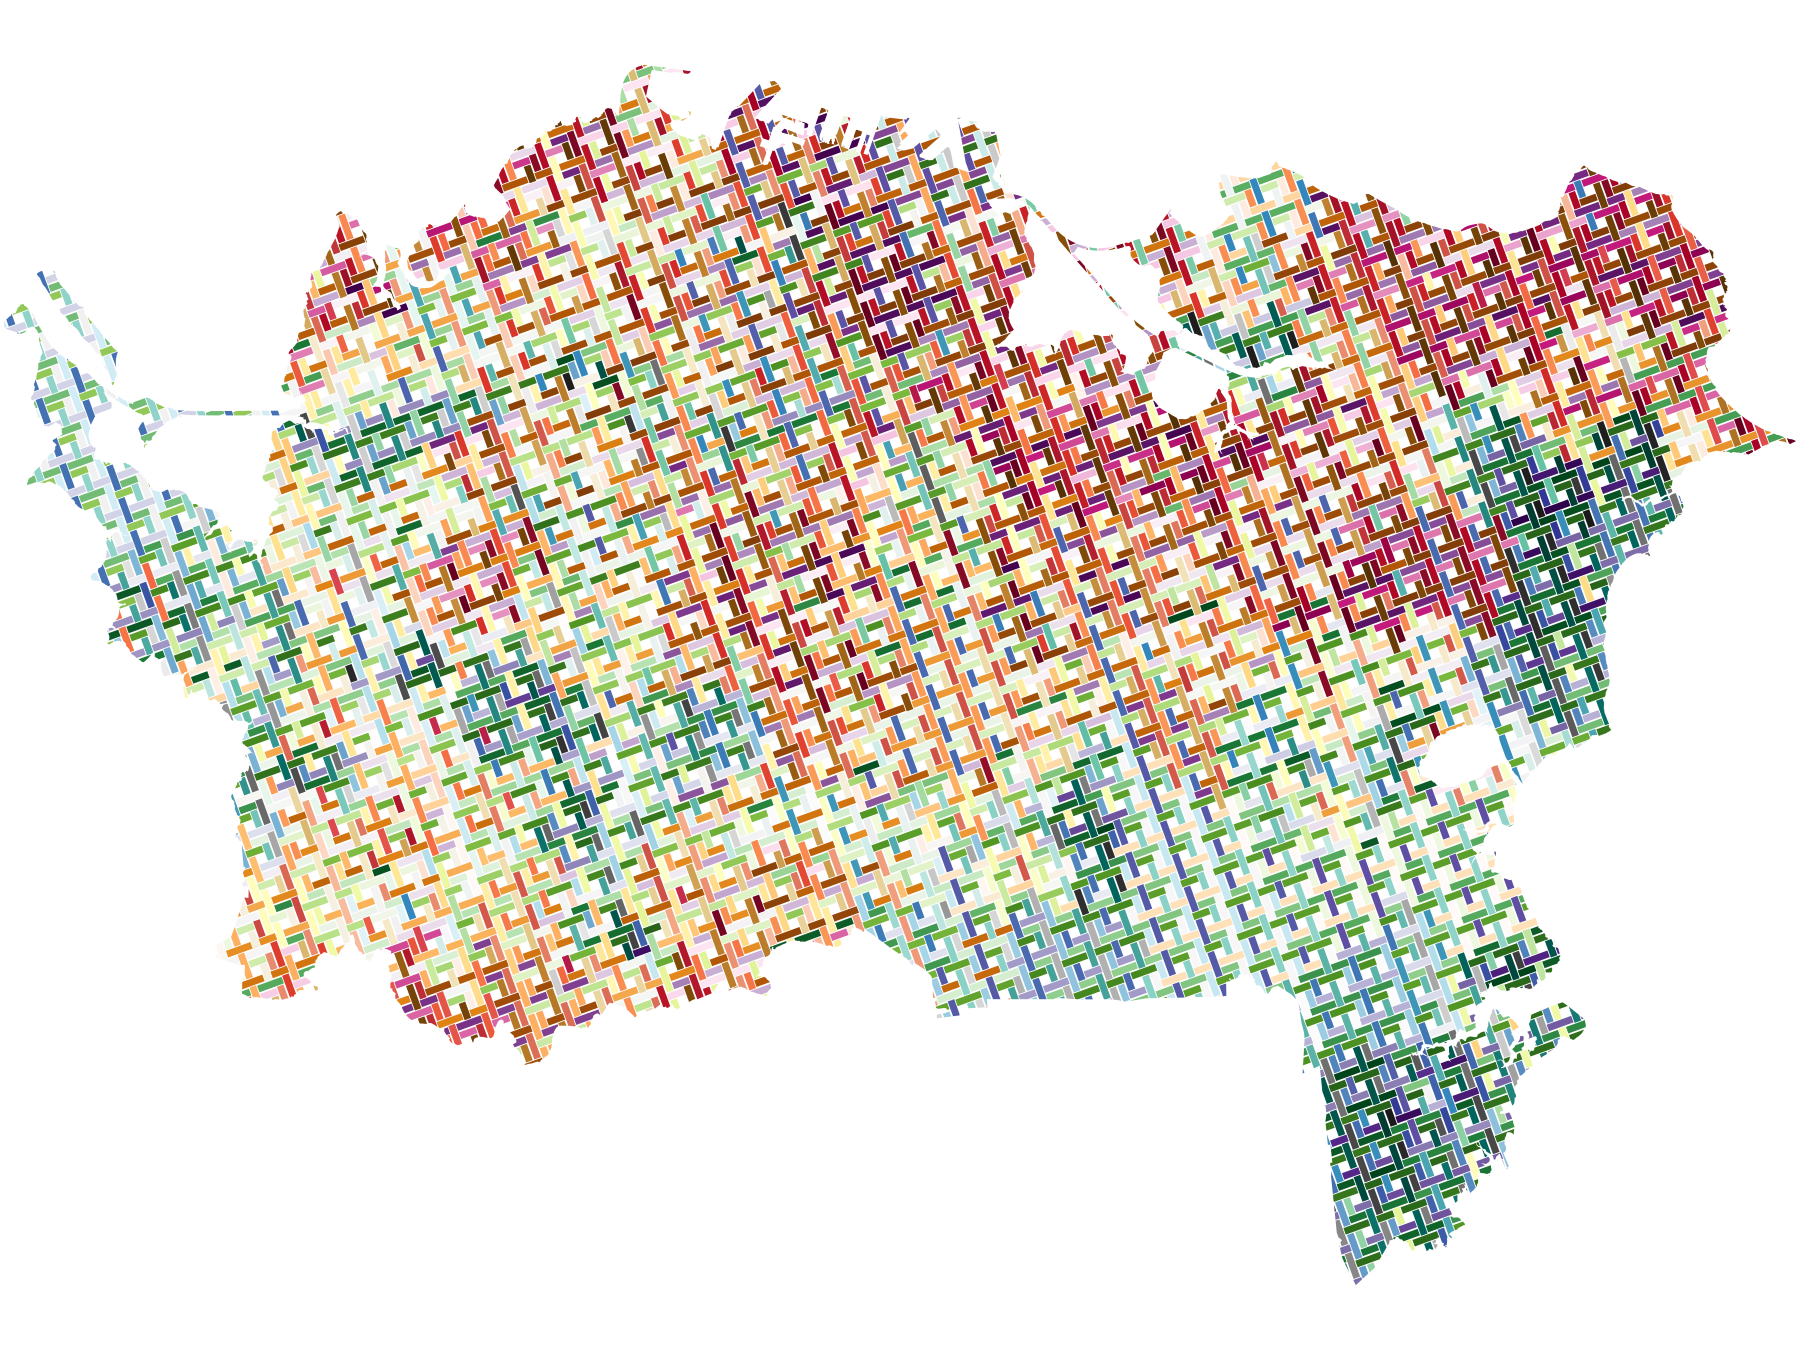
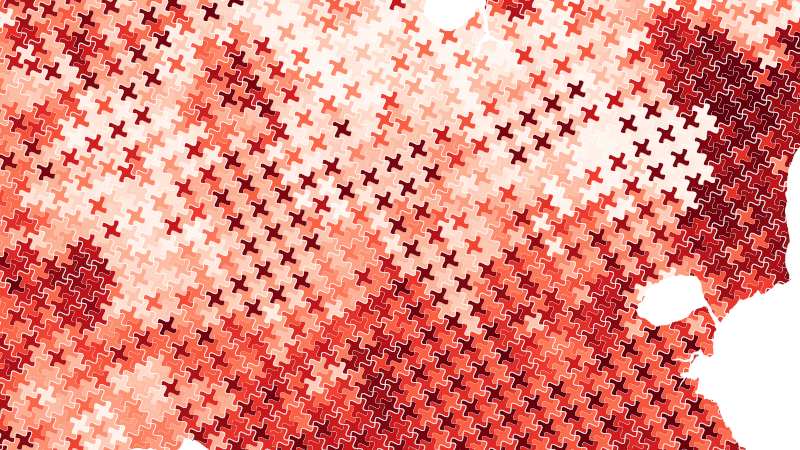
Different strands in the woven pattern represent different socioeconomic (or other) variables in the mapped area, and are coloured in the usual ‘choroplethic’ manner. We’re still figuring out the details, but some of the resulting maps are quite striking. Here’s a tiled (not woven) one
Explanations of exactly what the heck is going on here are at the project repo, where you’ll also find links to presentations, example notebooks, and the code to make maps like these yourself!
![]()