If you’ve seen me or my co-conspirator Luke Bergmann present at a cartographic meeting recently, there’s a fair chance you’ve heard us talk about using tiling and/or weaving to make maps of complex multivariate data.1 The idea is to break up map areas into multiple units by tiling so that we have available more than one shape to colour choropleth-style so that we can represent more than one variable in each area.
People have been enthusiastic about the concept and the look of the maps, but (I’m fairly sure) reticent about taking up the idea because doing so demanded a willingness to dive into writing python code to make such maps, or even just to explore the idea. For example, this talk which gives a useful overview of the concepts is liberally sprinkled with snippets of python code. That was intended to make it easier for anyone interested to jump in and have a go at making their own maps. But realistically, it probably discouraged the vast majority!
Anyway, I recently came across a tool called marimo that enables creation of reactive python notebooks, which are shareable as apps. That got me thinking about providing a way to make tiled maps without writing code, which might get a few more people interested in the idea.
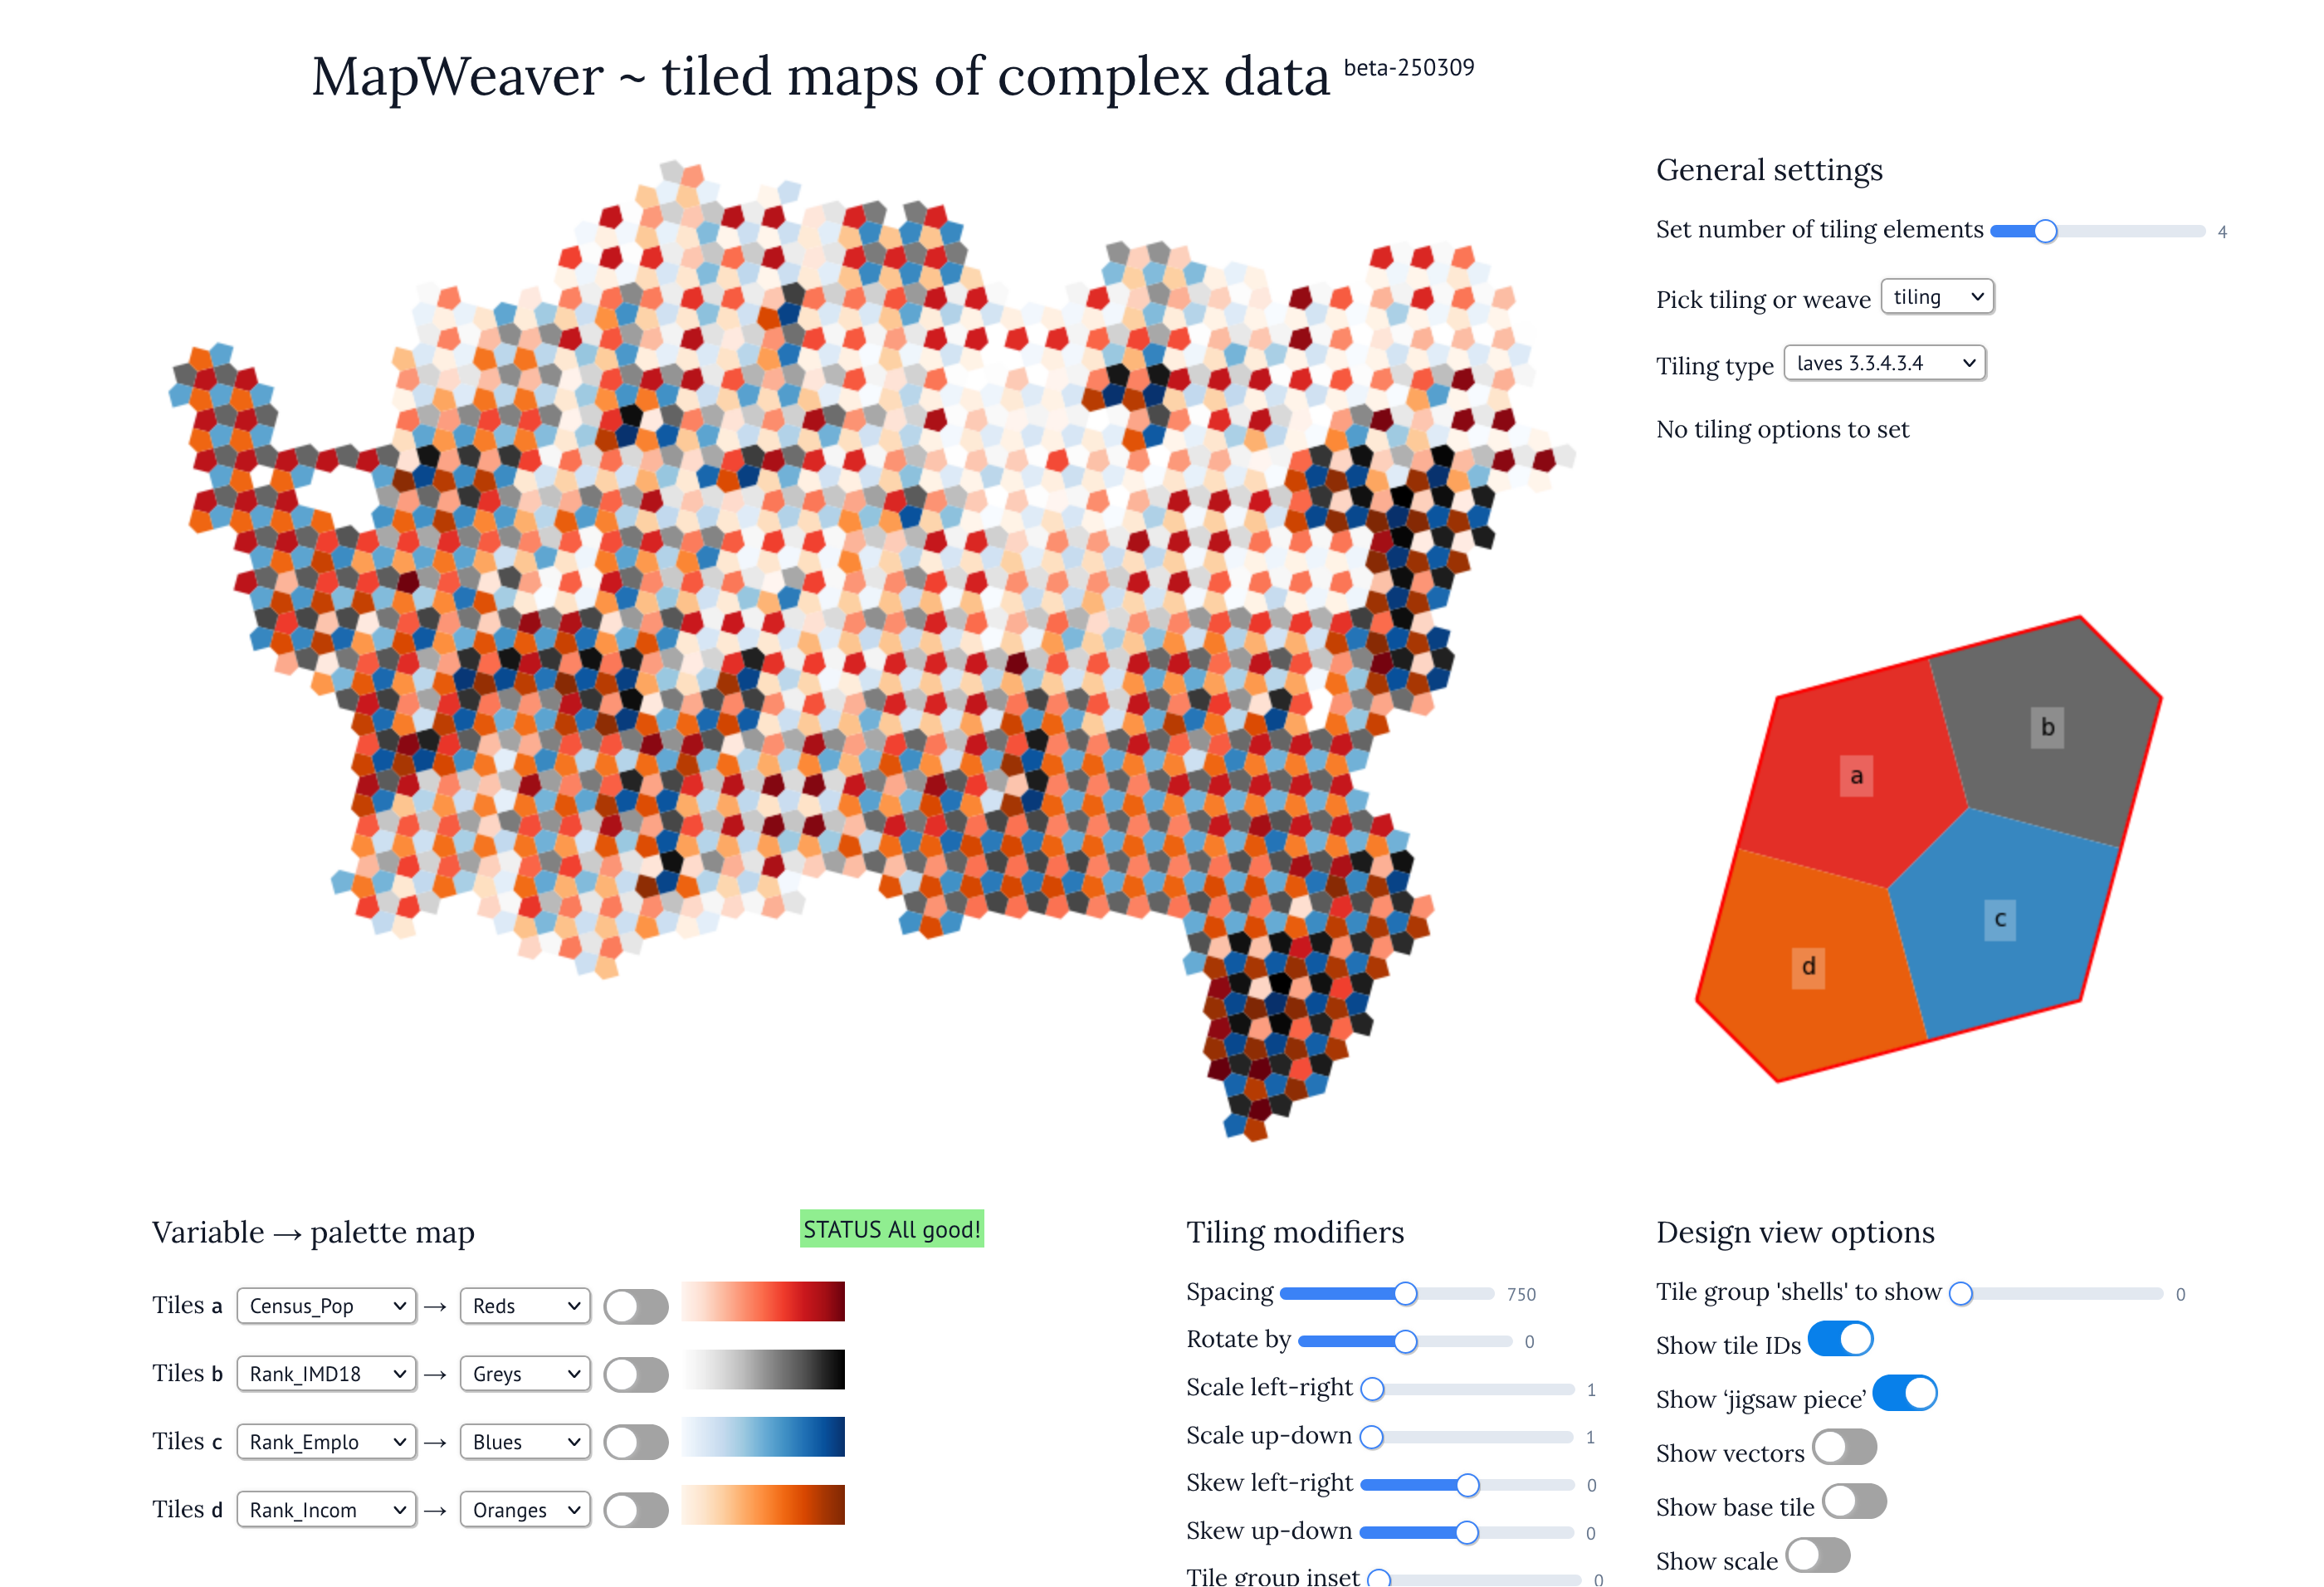
A prototype web app: MapWeaver2
It’s almost there.
Load the app in another tab by clicking the button below. It takes a while to load, so in the meantime keep reading…
Using the app you can experiment with different tiling designs on a multivariate dataset: Dan Exeter’s Index of Multiple Deprivation3 for the central Auckland region in 2018.
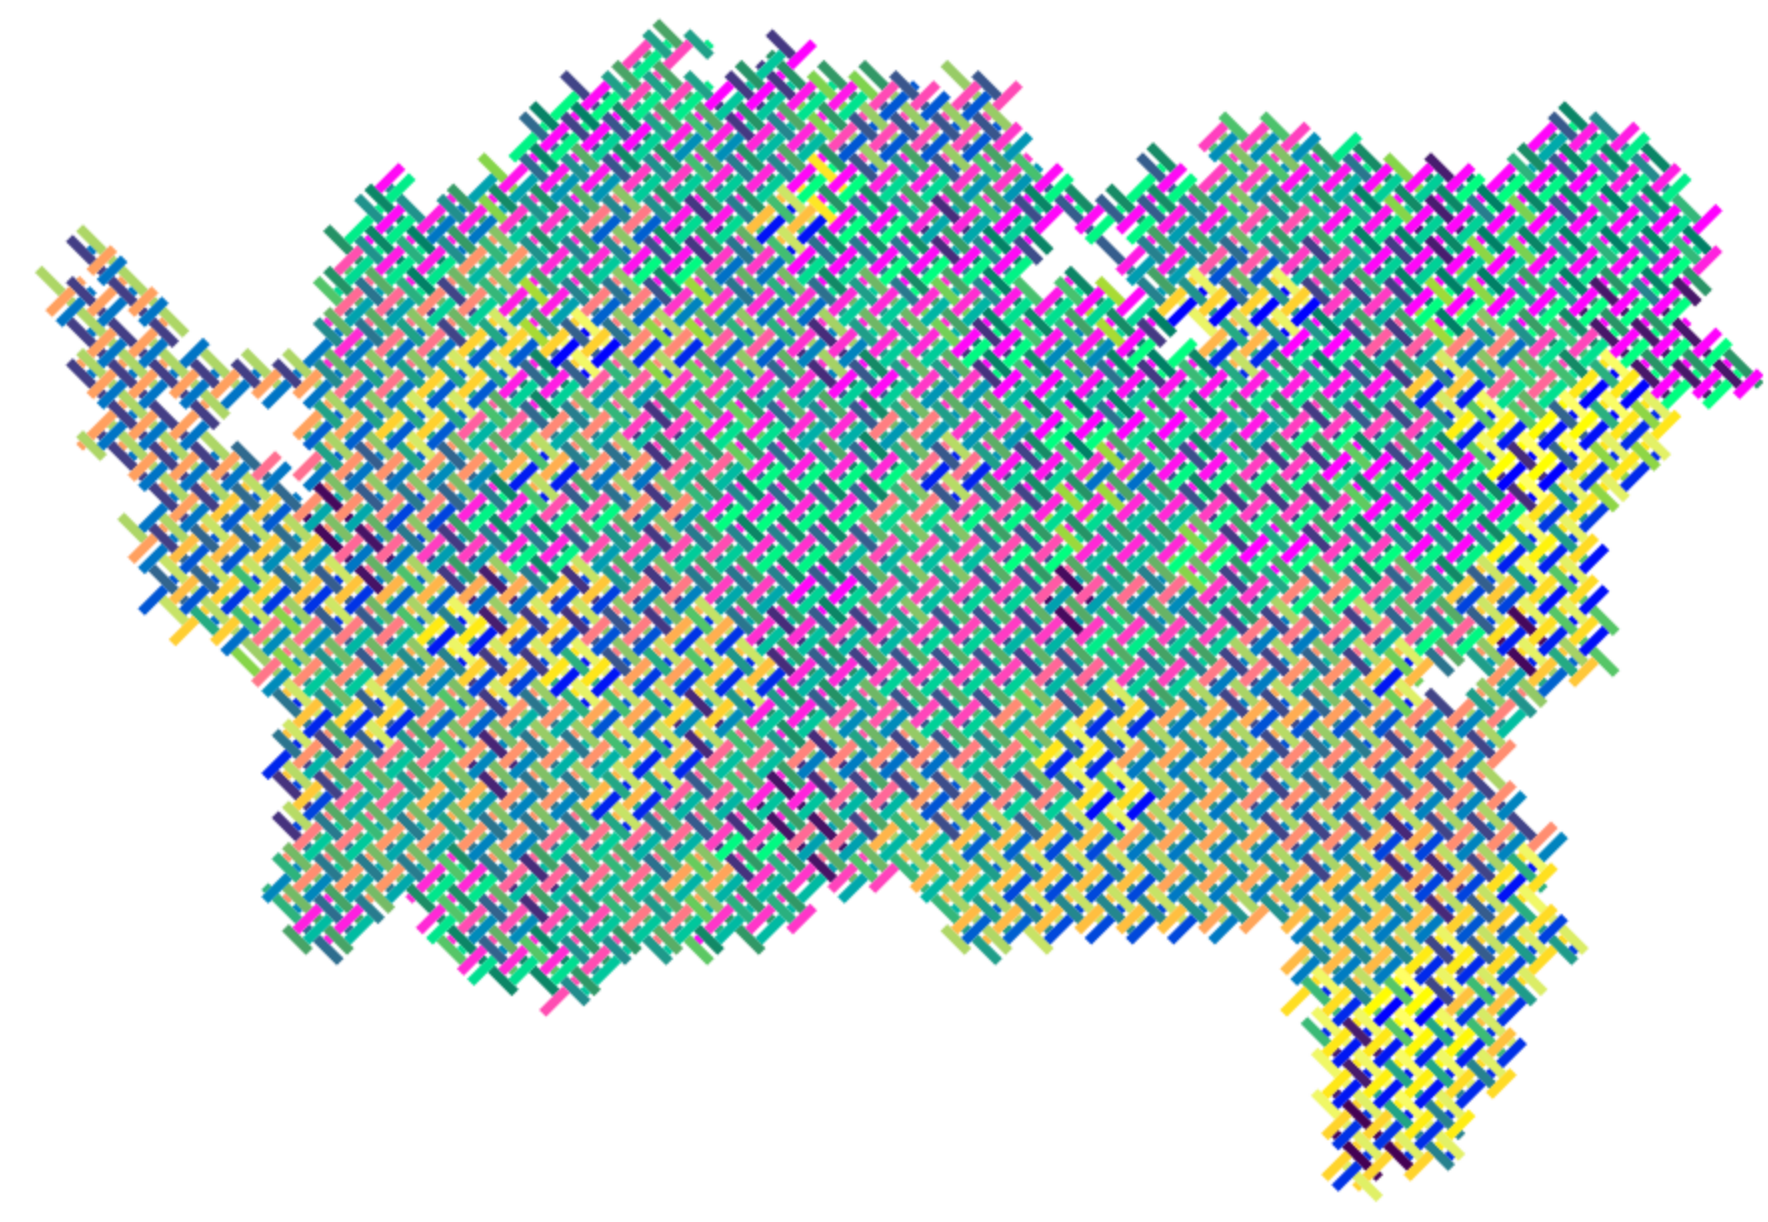
You can choose how many variables you want to include (between 2 and 10), and what kind of tiling or weave pattern you want to use. You can also choose colour ramps to associated with each of the chosen variables. So with a few clicks, you can make this map
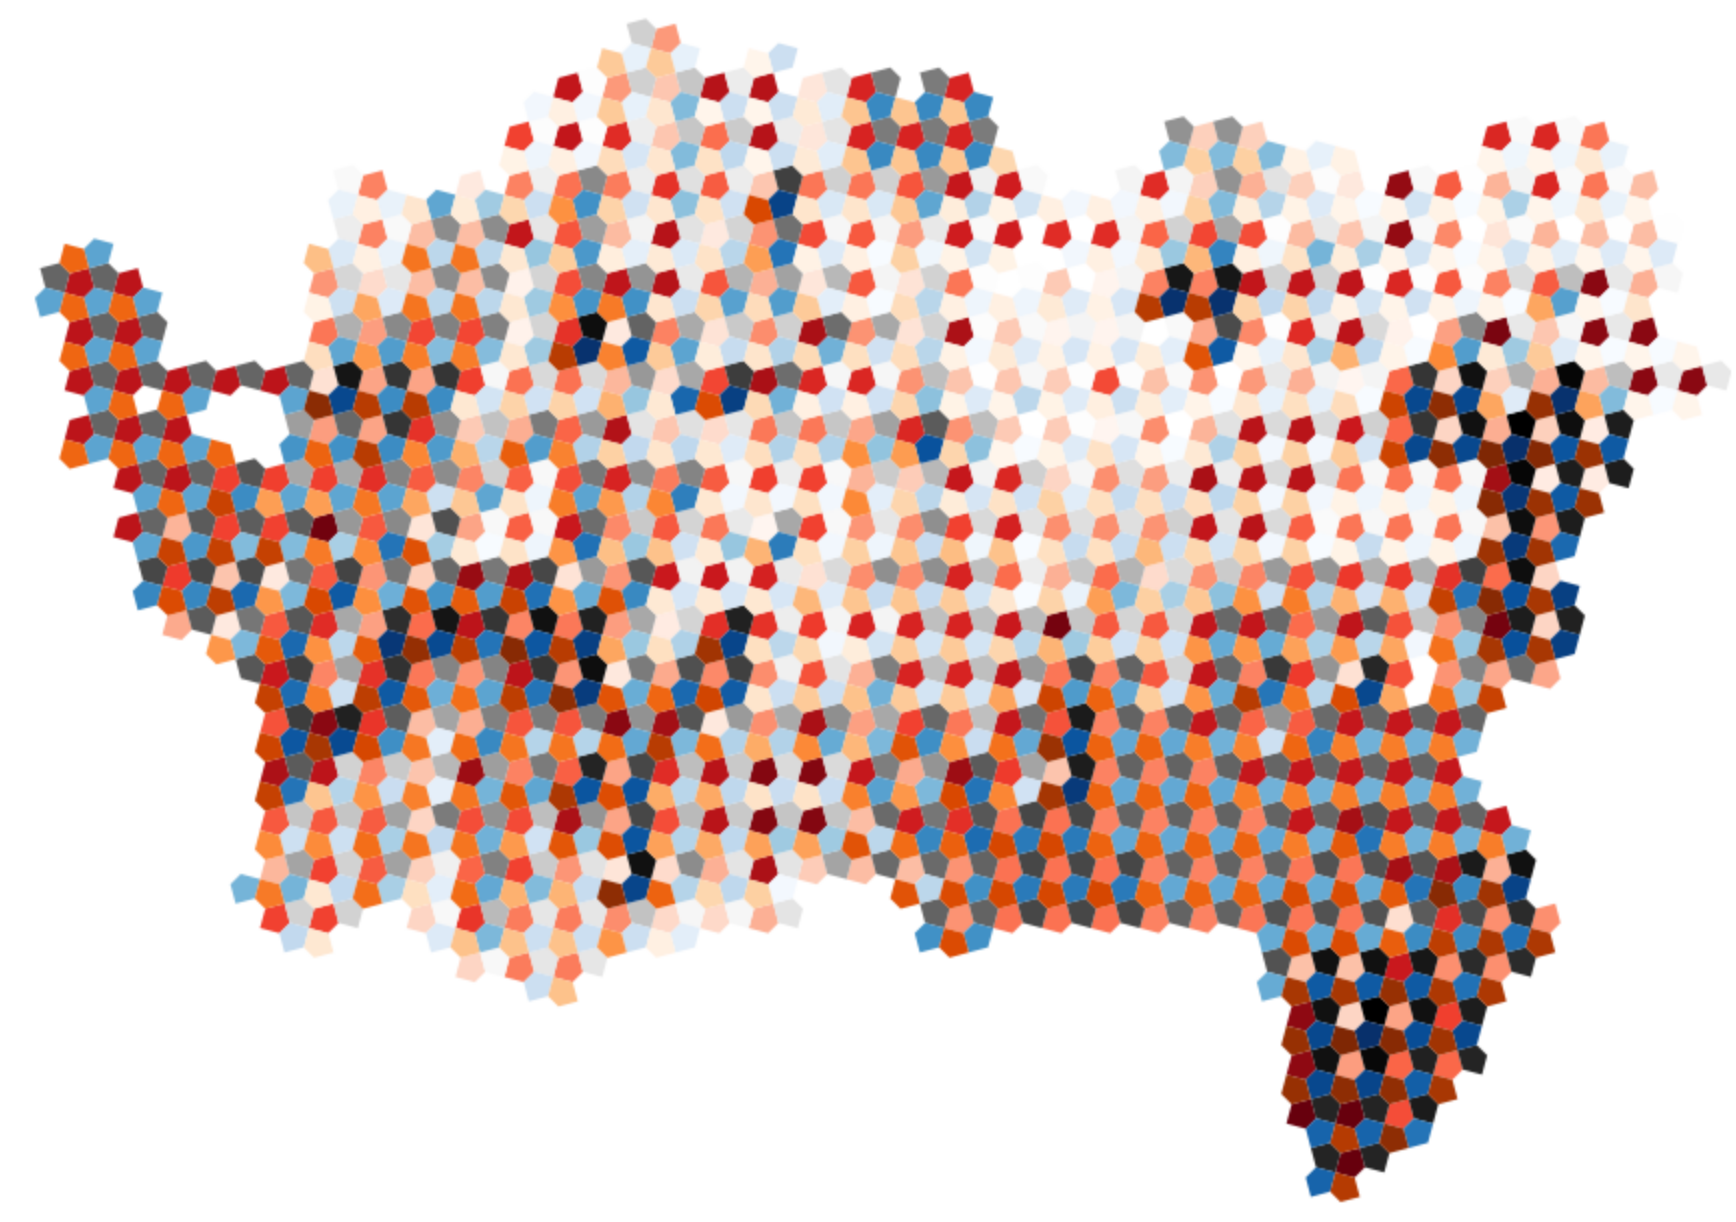
or this one
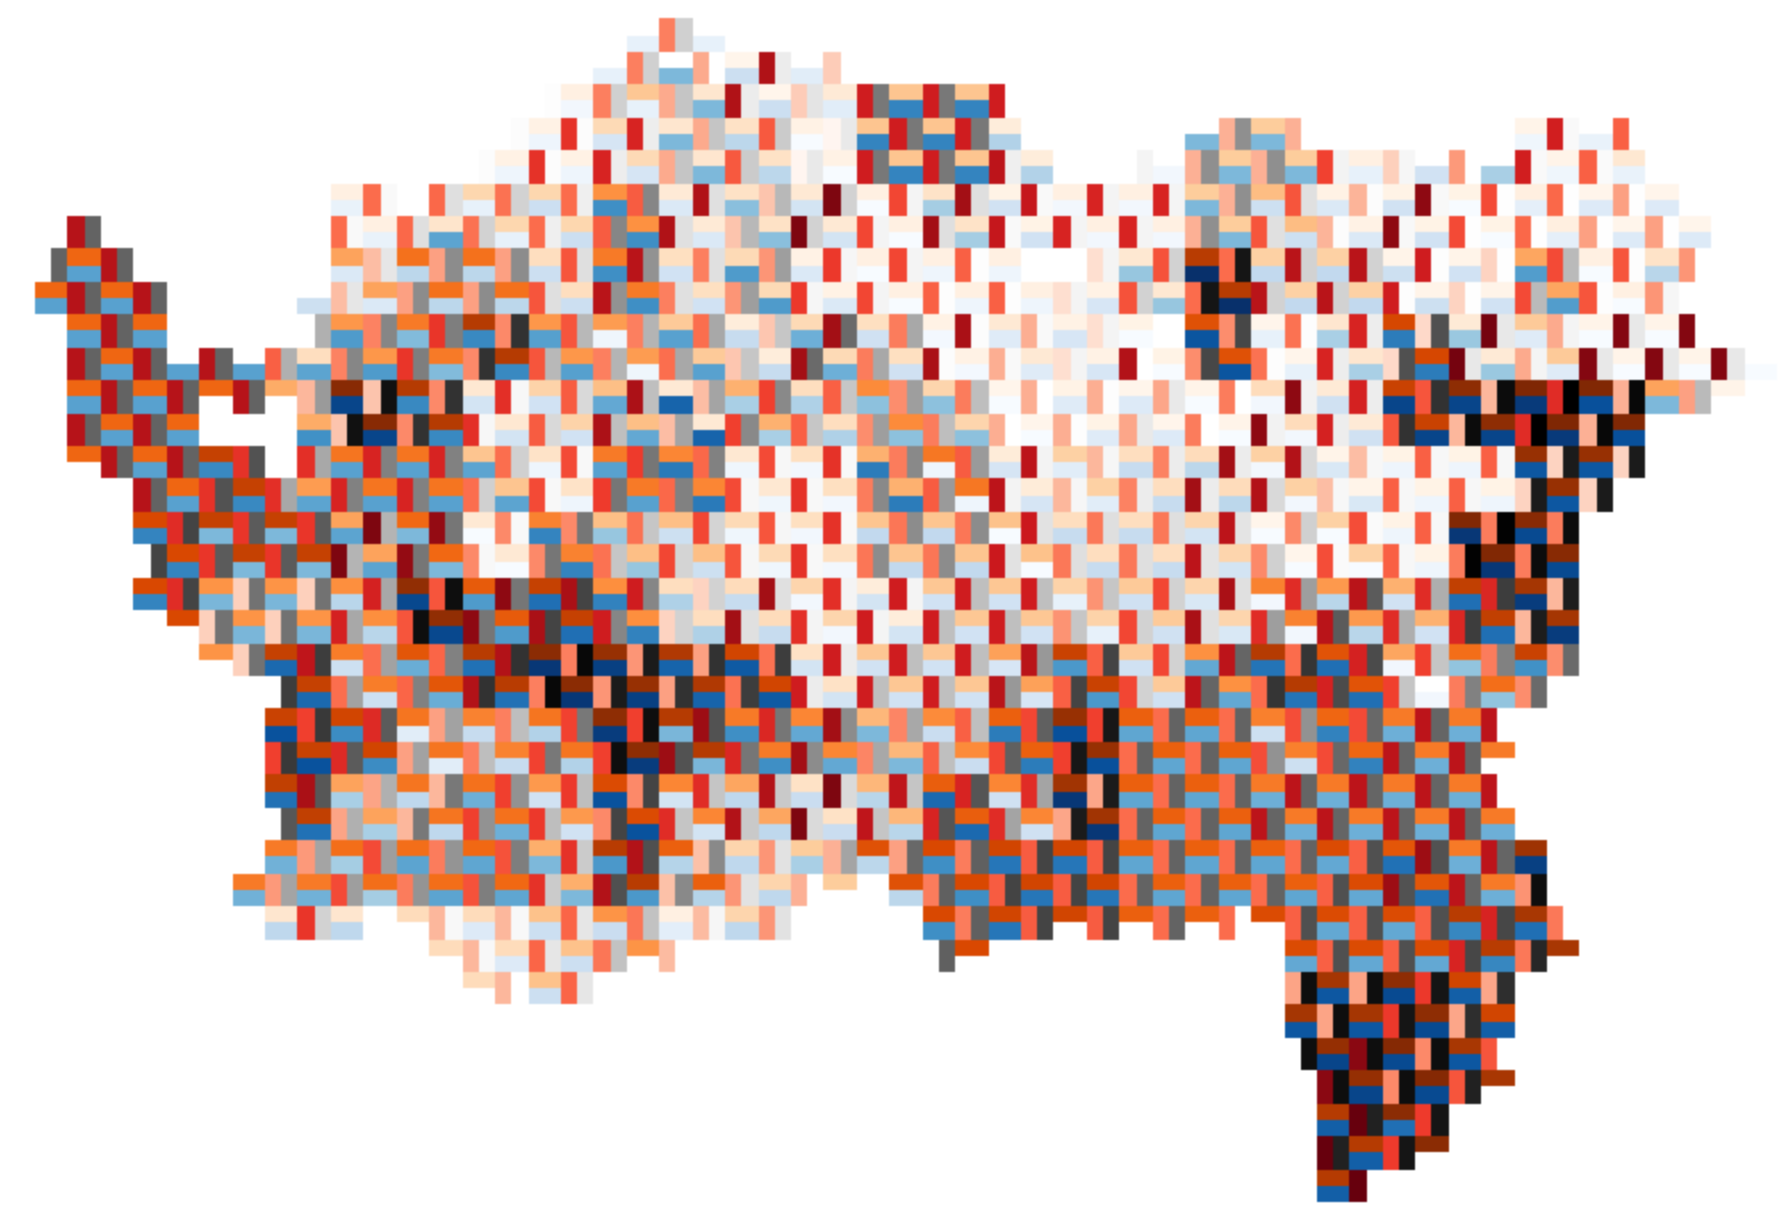
You can also modify the spacing or rotation of a chosen tiling, or (for a weave) the width of the strands
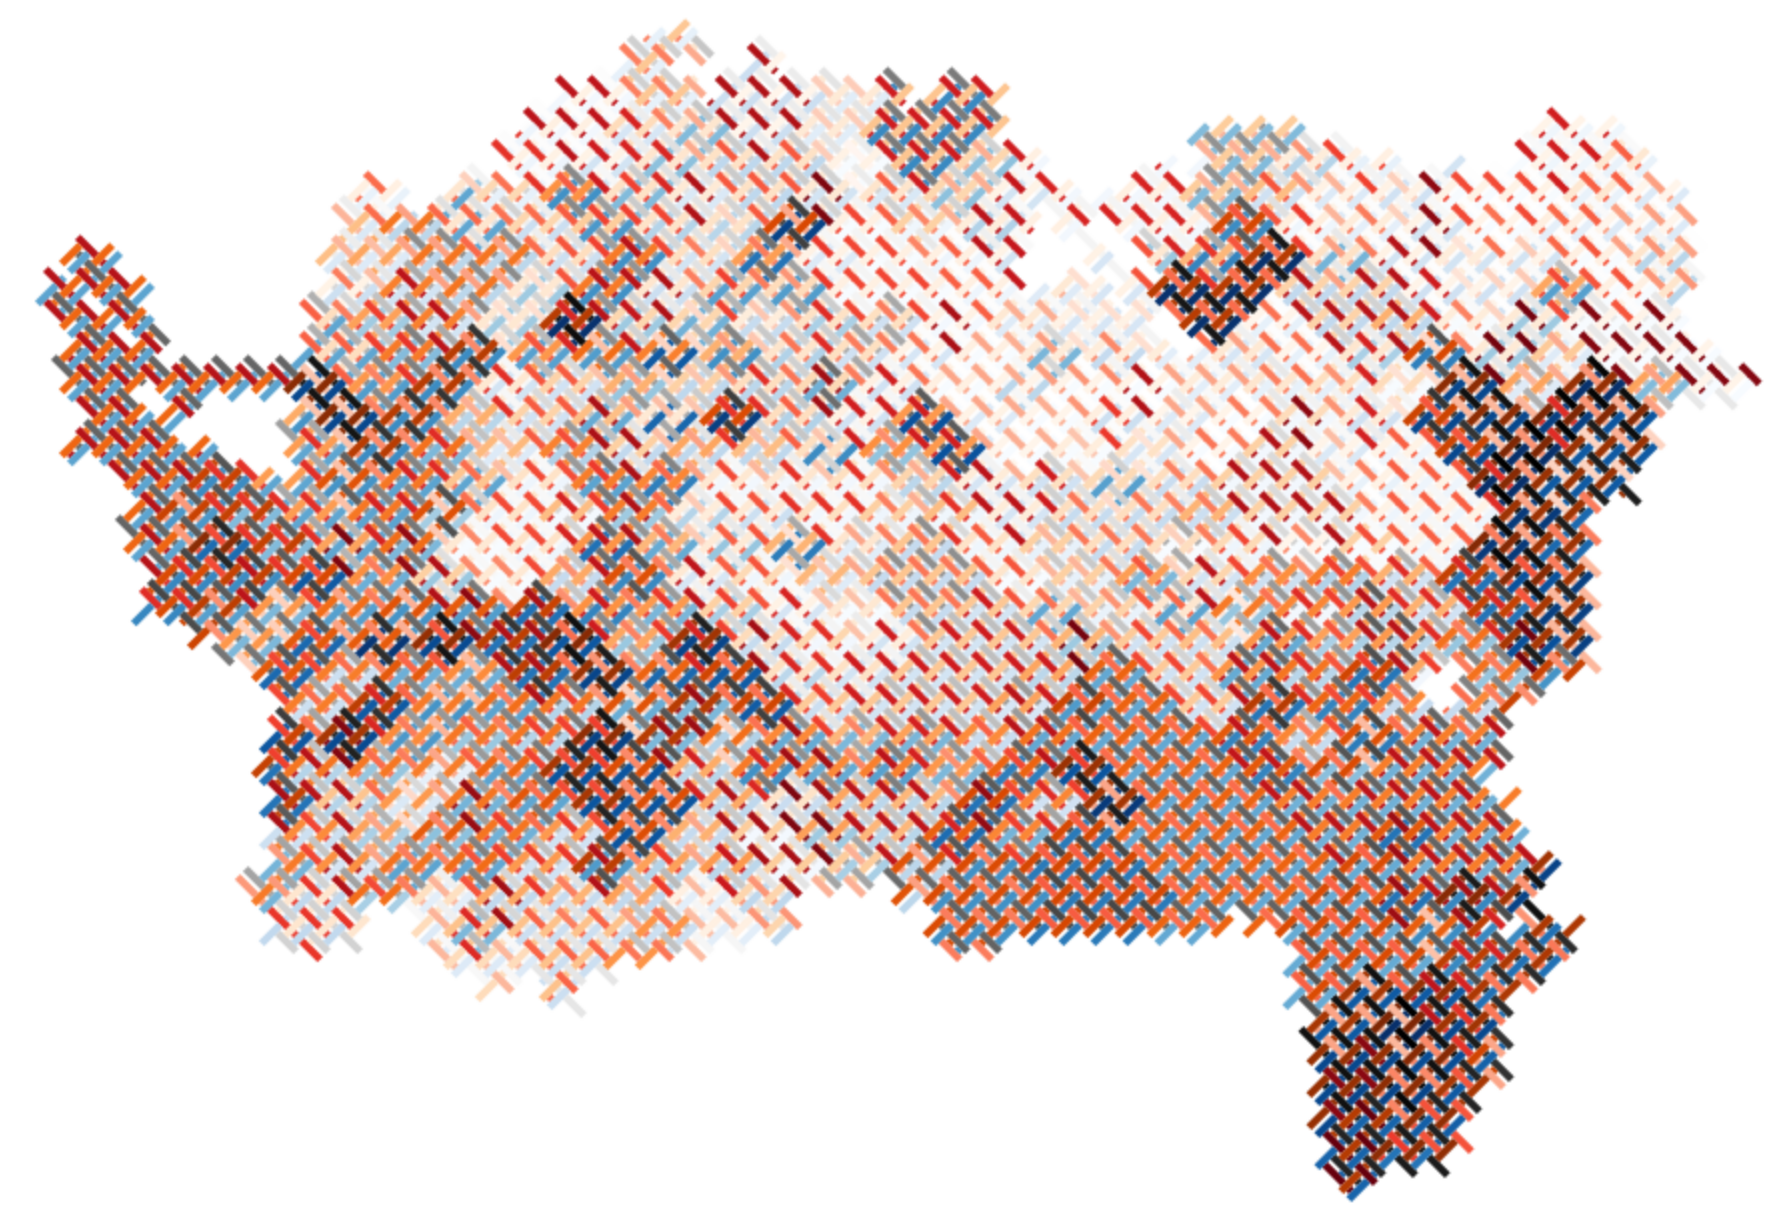
or experiment with different colour ramps and the resulting map appearance
Feedback welcome!
It’s proving trickier than I hoped to upload user data to the app (see this issue) so this isn’t the finished product, which will allow you to upload and tile your own data and download the results for further refinement in a GIS or graphics package. Even so, it would still be useful to get any thoughts or reactions from prospective users. Keep in mind:
- I know it is slow to load. I don’t think there is much I can do about this in a pyodide Web Assembly app that depends on several python packages beyond the core language. Just be patient… or if you have experience with this problem, and know how to fix it, get in touch and tell me how!
- It’s worth exploring the available options with spacing set to a high value so that the refresh of the map is faster. Once you have a pattern you are happy with, then adjust the spacing to the desired value.
That aside, any thoughts just get in touch on LinkedIn or email me! We’re also interested in thoughts about this mapping method, not just this implementation.
For more on how MapWeaver does what it does, check out the weavingspace code repository.
![]()
Footnotes
Nothing at all to do with web map tiles.↩︎
See also Exeter DJ, Zhao J, Crengle S, Lee A, Browne M, 2017, The New Zealand Indices of Multiple Deprivation (IMD): A new suite of indicators for social and health research in Aotearoa, New Zealand PLOS ONE 12(8) e0181260↩︎