As I’ve posted previously (see here, here, and here) Marimo is a promising new kind of reactive Python notebook. There’s a Quarto extension for it that makes it possible to embed reactive notebook interactivity into a blog post like this one.
By the time you have finished reading that paragraph, I hope the interactive bits of this post will have appeared below… if not, then just hang on a little longer.
[Unfortunately, Marimo doesn’t prevent programmers from making mistakes, and the original version of this post was a bit sloppy in how it generated the circles in Tissot’s indicatrix. I’ve now corrected that issue. The Marimo extension for Quarto makes some odd design choices that account for some of the ugliness in the page below, although on the plus side it has made integrating an interactive notebook in to a blog post very easy, so I’ll take it.]
Pick a new projection and marvel as the map of the world changes!
There’s not really very much more to say than that. The code driving this interaction is all pure python, but compiled to WASM so that it runs in the client on a browser.
The code that makes the UI elements like the drop-down and buttons is part of the marimo API, so for example, the code to make the drop-down and buttons looks like this:
Each of these is a mo.ui.<something> element (mo is the recommended marimo import alias) and they are embedded in markdown to provide labels and so on.
Everything else is standard Python whether base python or whatever modules you need to do the analysis and display the results your page is showing. Here’s the get_plot() function invoked above to plot the projected world map. You can see it gets the values of a dropdown called proj and two switches show_graticule and show_indicatrix to control the plot output.
The other thing to notice here is that due to marimo’s reactive nature, all this python code is ‘out of sequence’. The call to get_plot() comes before the function’s definition. For that matter, all the code to generate the graticule and so on is still to come:
This kind of thing is what drives me nuts any time I try to figure out what’s going on with javascript code, but somehow it seems kind of obvious in this setting.
Anyway, here, finally, is the code to provide the drop-down with its list of projections.
Actually… not quite. The next cell defines the data layers and the very last cell imports all the Python modules that everything runs on!
The clever thing that marimo does is to impose a couple of minor restrictions on your Python code which makes it (relatively!) easy to infer a directed acyclic graph(DAG) of the dependencies between cells, so that it can decide which cells to re-run when something updates. Unfortunately, you can’t really see that in this post. That kind of meta-revelation is beyond my skillset. But you can get a feel for it by looking at the python source for a version of this page here.
Each cell in a notebook is wrapped in a function and added to an app object by the @app.cell decorator. You can only define any variable in a notebook in a single cell. This can be awkward making throwaway variable names like i, j, k, x, and y unuseable, so marimo considers any variable that starts with a _ limited to the scope of the cell it is used in (so you can use _i, _j and so on for those convenience variables anywhere you like).
All the ‘public’ variables with plain names in your notebook are considered return values of the cells (wrapped as functions) that define them, and as parameters of the cells (wrapped as functions) that consume them. This makes building the dependency graph fairly easy and allows marimo to do its reactive thing without you having to think too hard about ‘callbacks’ and all the other stuff you probably associate with trying to code reactively in other settings.
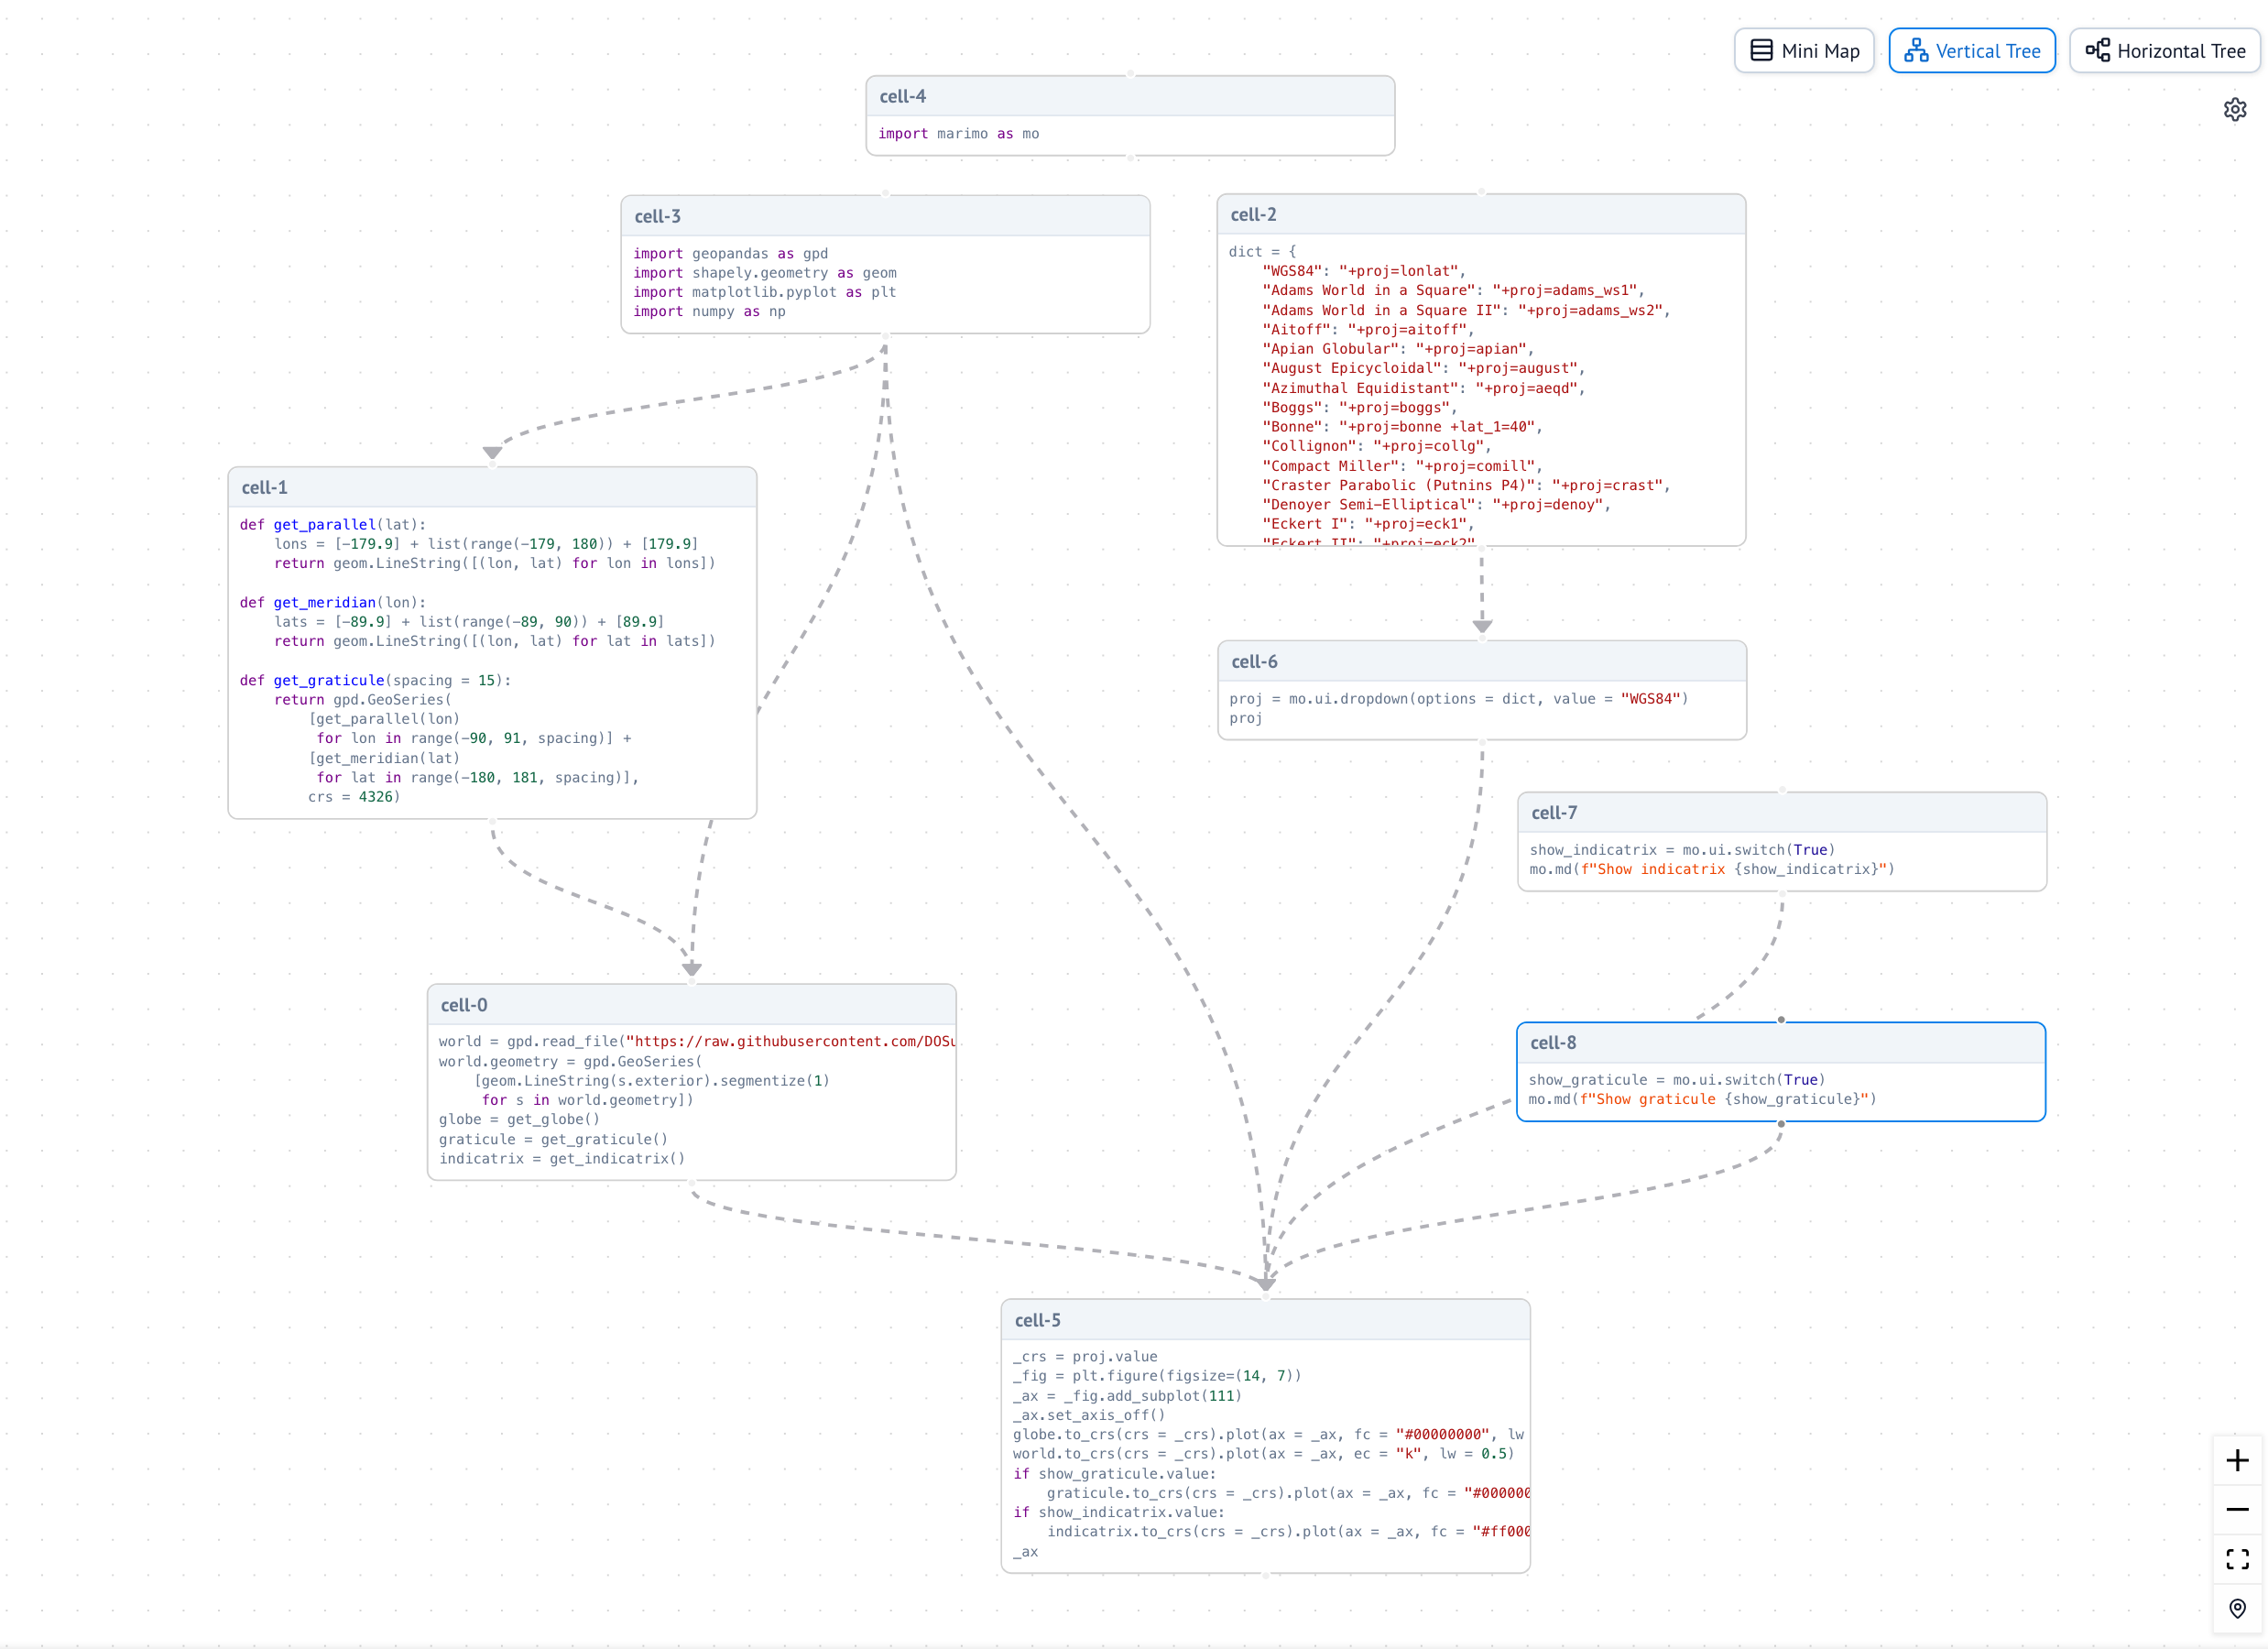
Here’a screenshot of the DAG for an earlier version of the code on this page.
Anyway, regardless of how it works, it just does and one outcome of that is the potential for web interactivity baked into blog posts like this one!
![]()