Code
import pandas as pd
import geopandas as gpd
import matplotlib.pyplot as plt- 1
- For making maps (albeit with some difficulty!)
Putting materials together for a short training course on introductory python programming for GISers, and also for two sessions on making maps and doing GIS in R for ResBaz 2025 I was once again puzzled by how the generally great tools in these two free ecosystems for doing geospatial analysis make it at best non-obvious and at worst downright difficult to do some seemingly obvious things.
A case in point is counting points in polygons. Herewith then, recipes in Python and in R for doing just that.
geopandasimport pandas as pd
import geopandas as gpd
import matplotlib.pyplot as pltHere are the data we’ll use in both examples. It doesn’t much matter where they are from or what they relate to for present purposes.
points = gpd.read_file("points.gpkg")
polygons = gpd.read_file("polygons.gpkg")

ax = polygons.plot(lw = 0.5, fc = "lightgrey", ec = "w", figsize = (10, 10))
points.plot(ax = ax, markersize = 1, color = "k")
ax.set_axis_off()
plt.show()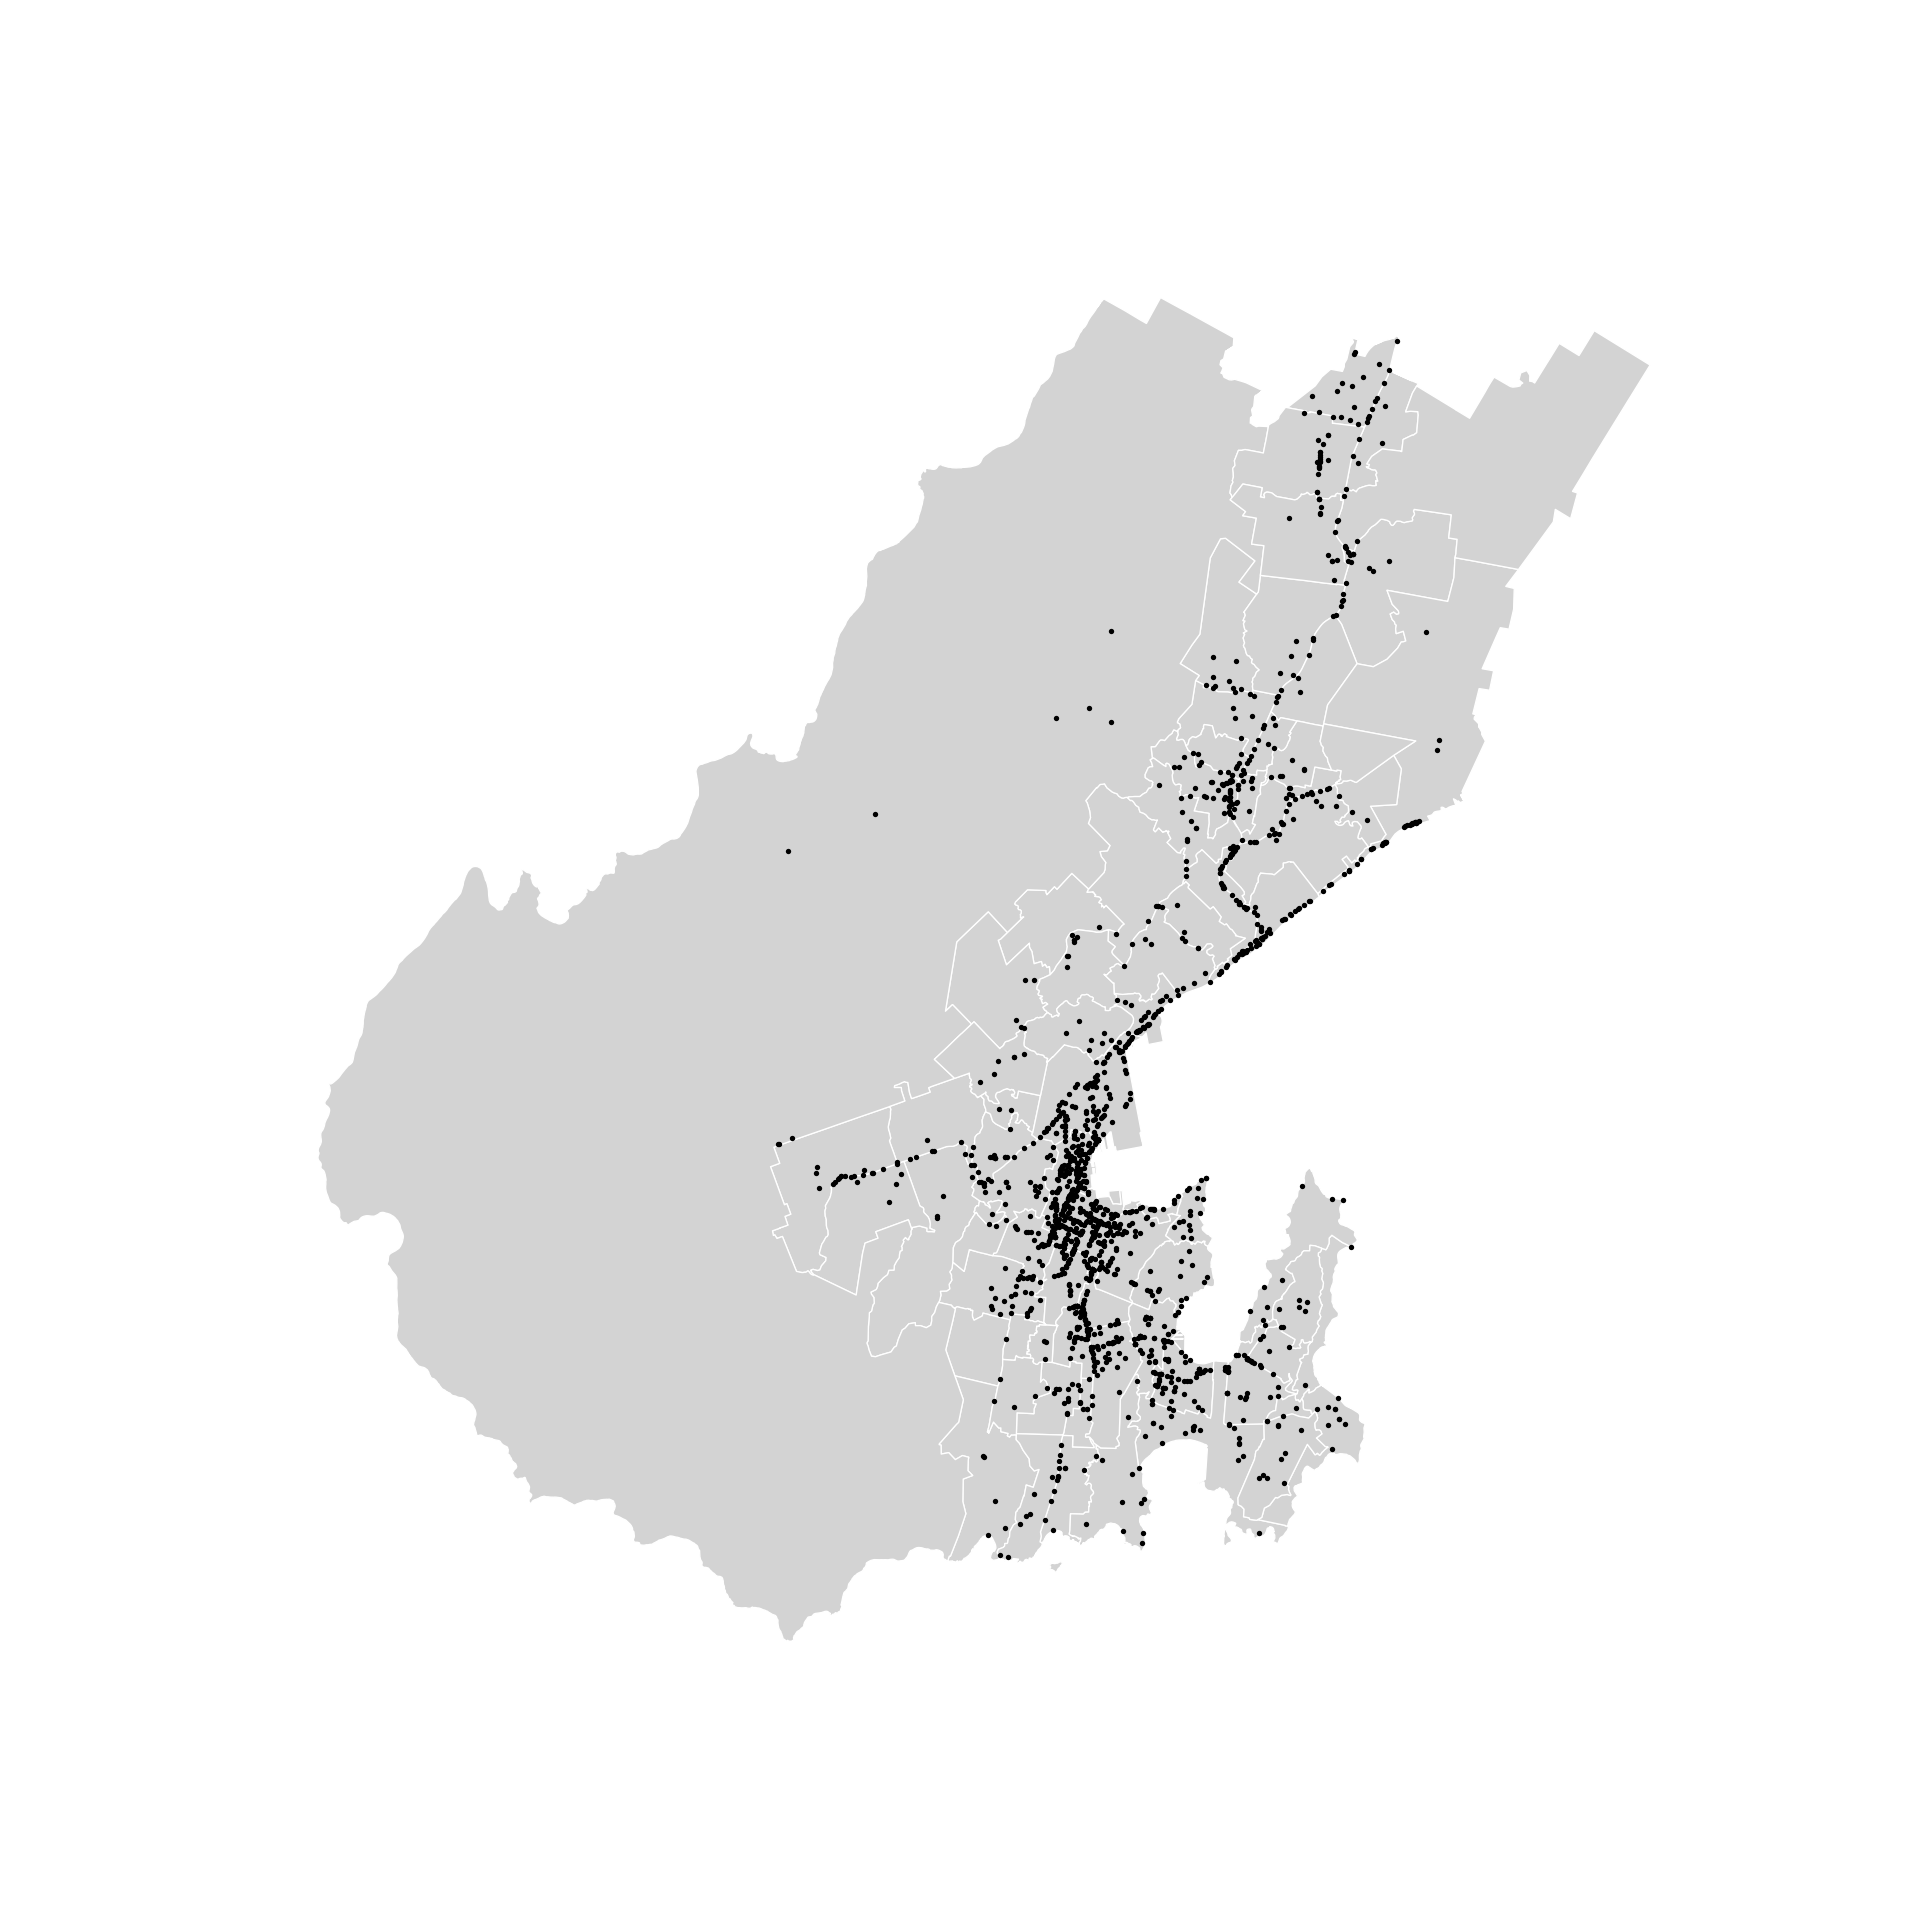
GeoSeries spatial predicate methodsI’m not going to be nice about this. geopandas makes counting points in polygons unreasonably complicated. Maybe I am missing something. But I don’t think so.1
The heart of the problem is that the binary spatial predicate functions applicable to GeoSeries, for reasons that are unclear, are applied row-wise, not pair-wise between every possible combination of the two GeoSeries being compared. That’s what the various sf::st_* functions in R do, and is the basis for the approach available there (see below).
That means that what (say) polygons.contains(points) returns is a list of boolean True/False results for whether the first polygon contains the first point, the second polygon the second point, and so on. I have a hard time thinking of a situation where this would be useful information. You can get it to base the alignment between rows on an index variable, but it’s unclear how this makes the process any more useful. That leaves little choice, using the spatial predicate functions, but to iterate over the two GeoSeries and compile counts. You can halfway use the vectorised operation of geopandas by counting how many points are in each polygon, but iterating over the polygons in python seems to be unavoidable.
We can make this into a (near) one-liner, although it took me a while to figure out the code below, which is the same basic idea as the approach shown later for R.
n_points = {
  name: points.geometry.within(polygon).sum()
  for name, polygon in zip(polygons.name, polygons.geometry)
}
n_points = pd.Series(n_points.values(), name = "n_points")
n_points
0 34
1 26
2 1
3 0
4 7
...
83 8
84 0
85 208
86 6
87 0
Name: n_points, Length: 88, dtype: int64And that’s a data series we can add to the original polygon dataset:
pd.concat([polygons, n_points], axis = "columns") name ... n_points
0 Adelaide ... 34
1 Aro Street-Nairn Street ... 26
2 Awarua ... 1
3 Belmont ... 0
4 Berhampore East ... 7
.. ... ... ...
83 Wadestown ... 8
84 Wellington City-Marinas ... 0
85 Willis Street-Cambridge Terrace ... 208
86 Wilton ... 6
87 Woodridge ... 0
[88 rows x 3 columns]But I don’t know. This just feels wrong, and I have no confidence it will scale well because we are iterating over the polygons in Python (even if I am using a comprehension).
Here are a couple of other cunning plans to get the point counts in polygon data table order.
# define a convenience function
def points_in_polygon(poly, pts):
  return poly.contains(pts).sum()

polygons.geometry.apply(points_in_polygon, pts = points.geometry).rename("n_points")
0 34
1 26
2 1
3 0
4 7
...
83 8
84 0
85 208
86 6
87 0
Name: n_points, Length: 88, dtype: int64Or even using a lambda function (if you are truly obsessed with one-liners).
polygons.geometry.apply(lambda x: x.contains(points.geometry).sum()).rename("n_points")0 34
1 26
2 1
3 0
4 7
...
83 8
84 0
85 208
86 6
87 0
Name: n_points, Length: 88, dtype: int64Whether or not these make the whole operation vector-based is unclear. The pandas apply() function should be, and the function we are applying is vectorised over the GeoSeries of points but limited testing the speed of all three approaches2 suggests there is not much to choose between them performance-wise.
GeoDataFrame.sjoinA more conservative approach is to use spatial join operations, then do some post-join clean up, then join the resulting point counts back to the original data. Here’s a sequence of steps I’ve settled on over time. Strap in…
First spatially join the points to the polygons.
polygons.sjoin(points, how = "left") name ... point_id
0 Adelaide ... 966.0
0 Adelaide ... 1154.0
0 Adelaide ... 710.0
0 Adelaide ... 155.0
0 Adelaide ... 1377.0
.. ... ... ...
86 Wilton ... 272.0
86 Wilton ... 397.0
86 Wilton ... 170.0
86 Wilton ... 1502.0
87 Woodridge ... NaN
[1704 rows x 4 columns]We have multiple copies of each polygon each associated with a single point, and because we used how = "left" we have retained even those polygons with no matching points. Now we can use groupby to group entries that share the same polygon name and count how many of each there are. Because the count() method ignores missing data it will count the polygons with no matching point as zeros (this is a rather finicky, and I would guess potentially fragile detail).
(polygons.sjoin(points, how = "left")
.loc[:, ["name", "point_id"]]
.groupby("name", as_index = False)
.count()) name point_id
0 Adelaide 34
1 Aro Street-Nairn Street 26
2 Awarua 1
3 Belmont 0
4 Berhampore East 7
.. ... ...
83 Wadestown 8
84 Wellington City-Marinas 0
85 Willis Street-Cambridge Terrace 208
86 Wilton 6
87 Woodridge 0
[88 rows x 2 columns]We should rename that column to reflect the information it now contains.
(polygons.sjoin(points, how = "left")
     .loc[:, ["name", "point_id"]]
     .groupby("name", as_index = False)
     .count()
     .rename(columns = {"point_id": "n_points"}))
name n_points
0 Adelaide 34
1 Aro Street-Nairn Street 26
2 Awarua 1
3 Belmont 0
4 Berhampore East 7
.. ... ...
83 Wadestown 8
84 Wellington City-Marinas 0
85 Willis Street-Cambridge Terrace 208
86 Wilton 6
87 Woodridge 0
[88 rows x 2 columns]And finally, we’d want to join all this back to the original data.
pip = polygons.merge(
  polygons.sjoin(points, how = "left")
    .loc[:, ["name", "point_id"]]
    .groupby("name", as_index = False)
    .count()
    .rename(columns = {"point_id": "n_points"})
  )

pip
name ... n_points
0 Adelaide ... 34
1 Aro Street-Nairn Street ... 26
2 Awarua ... 1
3 Belmont ... 0
4 Berhampore East ... 7
.. ... ... ...
83 Wadestown ... 8
84 Wellington City-Marinas ... 0
85 Willis Street-Cambridge Terrace ... 208
86 Wilton ... 6
87 Woodridge ... 0
[88 rows x 3 columns]All told, that’s quite the journey. Here it all is wrapped up in a reusable function, which you are free to cut out and keep!
def count_points_in_polygons(
    polys:gpd.GeoDataFrame,
    pts:gpd.GeoDataFrame,
    id_var:str) -> gpd.GeoDataFrame:
    """Counts points in polygons and appends new column to GeoDataFrame.

    Args:
        polys (gpd.GeoDataFrame): the polygons within which to count.
        pts (gpd.GeoDataFrame): the points to count.
        id_var (str): a variable that uniquely identifies the polygons.

    Returns:
        gpd.GeoDataFrame: polygon GeoDataFrame with added column 'n_points'
            containing result.
    """
    pt_var = pts.columns[0]
    return polys.merge(
        polys.sjoin(pts, how = "left")
            .loc[:, [id_var, pt_var]]
            .groupby(id_var, as_index = False)
            .count()
            .rename(columns = {pt_var: "n_points"}))

count_points_in_polygons(polygons, points, "name")
name ... n_points
0 Adelaide ... 34
1 Aro Street-Nairn Street ... 26
2 Awarua ... 1
3 Belmont ... 0
4 Berhampore East ... 7
.. ... ... ...
83 Wadestown ... 8
84 Wellington City-Marinas ... 0
85 Willis Street-Cambridge Terrace ... 208
86 Wilton ... 6
87 Woodridge ... 0
[88 rows x 3 columns]I’ve again done some limited performance testing of this method and it definitely seems to be faster than the GeoSeries spatial predicate methods approaches. I assume this is because it is fully vectorised, and perhaps even makes use internally of spatial indexes, although I have no detailed knowledge of the inner workings of geopandas on which to base that guess…
Anyway, onwards to R!
sfsf, while still not having a true one-liner for this operation, at least makes things less difficult with pair-wise comparison based spatial predicate functions.
library(sf)
library(ggplot2)

points <- st_read("points.gpkg")
polygons <- st_read("polygons.gpkg")

point_counts <- polygons |>
  st_contains(points) |>
  lengths()

polygons$n_points <- point_counts
This is easier to make sense of than than the spatial join approach in geopandas, and because it’s based on a spatial predicate function that does pair-wise comparisons between geometries it’s also cleaner. The method relies on the base R lengths() function which reports the length of each vector of index numbers reported by st_contains in its default ‘sparse matrix’ mode.
Overall, it’s not at all obvious starting from a blank screen that this is how you should go about counting points in polygons in sf, but it works, and until someone tells me otherwise this is how I’ll do it.
Overall the sf approach isn’t so much work as to make it worth writing a function to apply it. Even so, like its geopandas equivalents it seems unnecessarily indirect!
Anyway, if you have stuck around this long, you’ve earned another map.
ggplot(polygons) +
  geom_sf(aes(fill = n_points)) +
  scale_fill_distiller(palette = "Reds", direction = 1) +
  theme_void()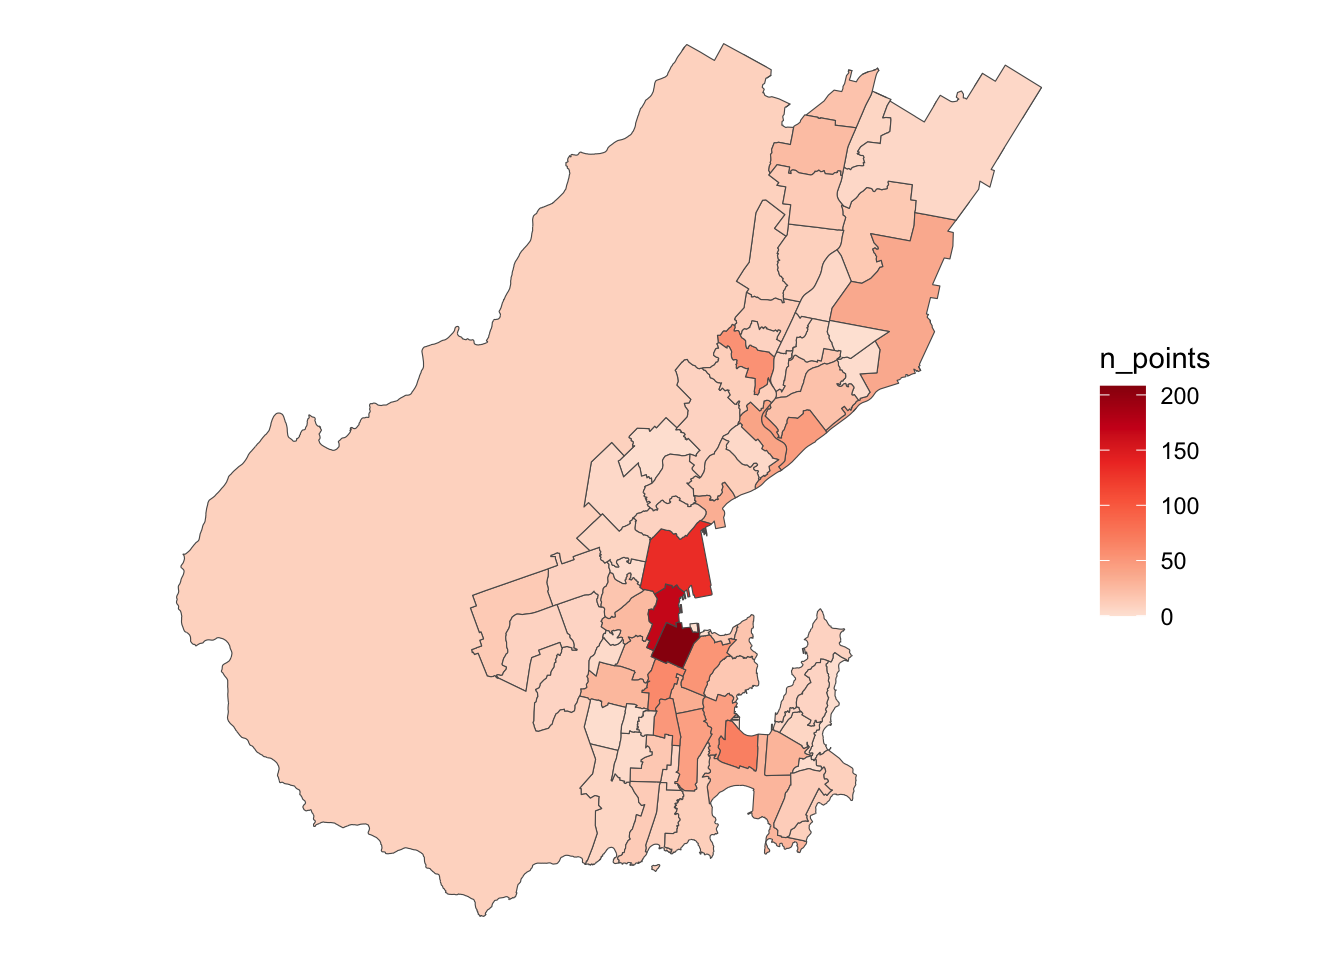
![]()
I would be happy to hear otherwise.↩︎
Using the ipython %timeit magic↩︎