Code
library(plot3D)
library(dplyr)A simple visualisation of geo-atoms in absolute space
library(plot3D)
library(dplyr)There isn’t a lot to this. Just make a bunch of random numbers…
data <- data.frame(x = rnorm(30), y = rnorm(30), z = rnorm(30))… and plot them.
scatter3D(x = data$x, y = data$y, z = data$z,
          theta = 25, phi = 30, scale = FALSE,
          xlim = range(data$x) * 1.1,
          ylim = range(data$y) * 1.1,
          zlim = range(data$z) * 1.1,
          pch = 19, col = "#999999", bty = "u", type = "h",
          asp = 1, col.axis = "#333333", col.panel = "#eeeeee",
          col.grid = "#666666", lwd.grid = 0.2, nticks = 6)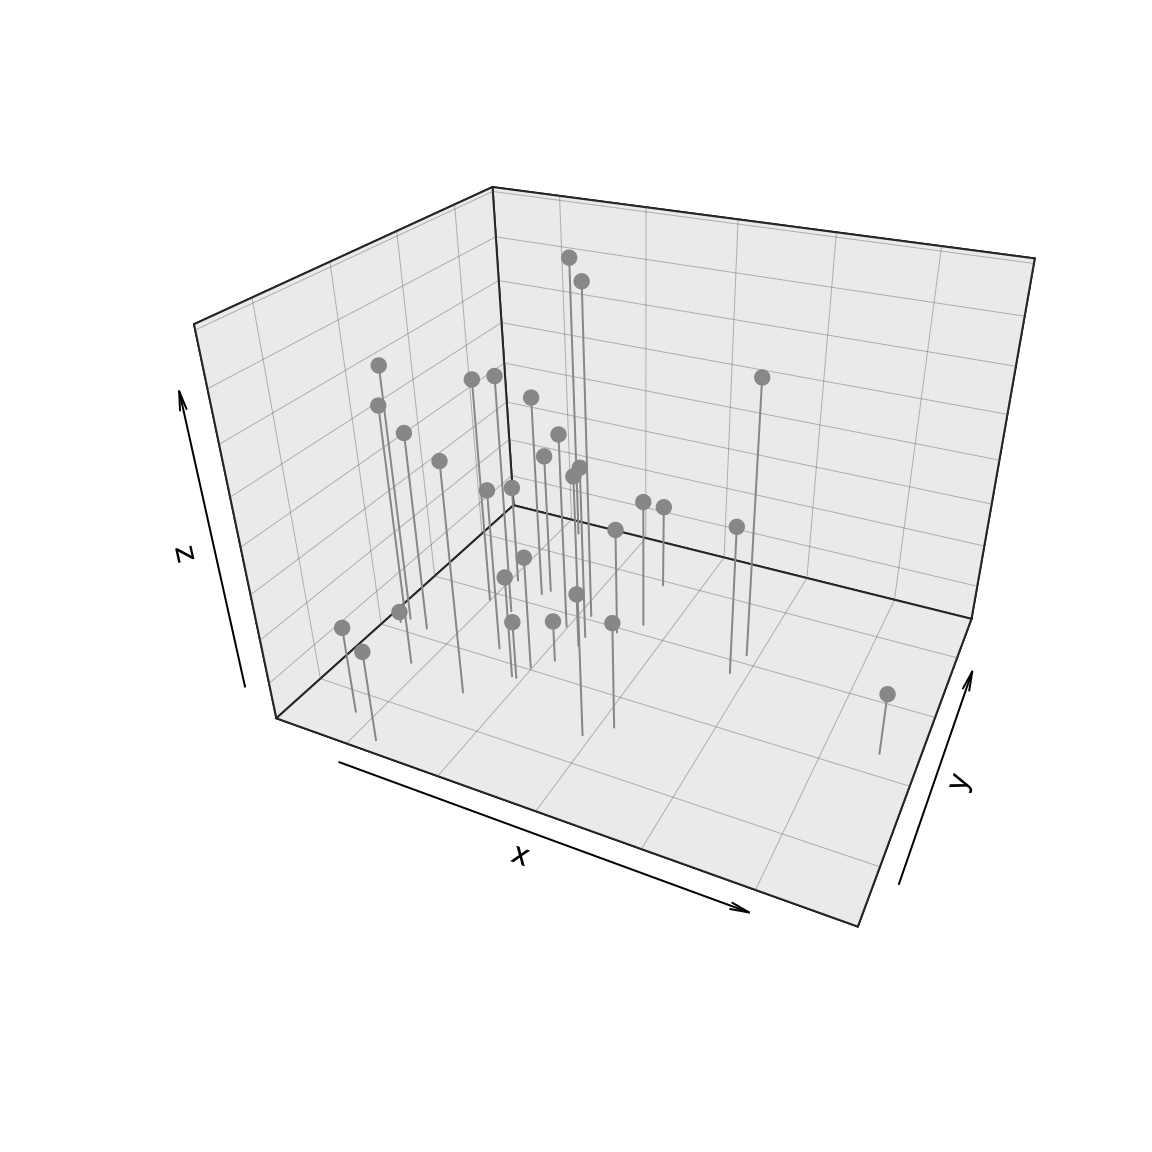
# License (MIT)
#
# Copyright (c) 2023 David O'Sullivan
#
# Permission is hereby granted, free of charge, to any person
# obtaining a copy of this software and associated documentation
# files (the "Software"), to deal in the Software without restriction,
# including without limitation the rights to use, copy, modify, merge,
# publish, distribute, sublicense, and/or sell copies of the Software,
# and to  permit persons to whom the Software is furnished to do so,
# subject to the following conditions:
#
# The above copyright notice and this permission notice shall be included
# in all copies or substantial portions of the Software.
#
# THE SOFTWARE IS PROVIDED "AS IS", WITHOUT WARRANTY OF ANY KIND, EXPRESS
# OR IMPLIED, INCLUDING BUT NOT LIMITED TO THE WARRANTIES OF MERCHANTABILITY,
# FITNESS FOR A PARTICULAR PURPOSE AND NONINFRINGEMENT. IN NO EVENT SHALL
# THE AUTHORS OR COPYRIGHT HOLDERS BE LIABLE FOR ANY CLAIM, DAMAGES OR OTHER
# LIABILITY, WHETHER IN AN ACTION OF CONTRACT, TORT OR OTHERWISE, ARISING
# FROM, OUT OF OR IN CONNECTION WITH THE SOFTWARE OR THE USE OR OTHER
# DEALINGS IN THE SOFTWARE.
© 2023-24 David O’Sullivan