Code
library(sf)
library(dplyr)
library(tidyr)
library(ggplot2)I’ve remade this one in colour, because I think it’s a bit easier to see this way.
Some libraries:
library(sf)
library(dplyr)
library(tidyr)
library(ggplot2)We need to make a grid of values, with a clear gradient in one direction. The code for making geometries in R is ugly, so I’ve hidden it.
make_square <- function(x = 0, y = 0, d = 1) {
  xs <- x + c(-1, 1, 1, -1) * d / 2
  ys <- y + c(-1, -1, 1, 1) * d / 2
  xs <- c(xs, xs[1])
  ys <- c(ys, ys[1])
  st_polygon(list(matrix(c(xs, ys), ncol = 2)))
}

grid <- expand_grid(x = 1:10, y = 1:10) |> as_tibble()

polys <- list()
for (r in 1:nrow(grid)) {
  polys <- c(polys, make_square(x = grid$x[r], y = grid$y[r]))
}

poly_sf <- polys |>
  lapply(list) |>
  lapply(st_polygon) |>
  st_sfc() |>
  st_sf(x = grid[, 1], y = grid[, 2])

poly_sf$z <- poly_sf$x + runif(nrow(poly_sf), -0.5, 0.5)
Anyway… we have a 10 by 10 grid of squares with values that increase from left to right:
brks <- .5 + (0:100) / 10

ggplot(poly_sf) +
  geom_sf(aes(fill = z)) +
  scale_fill_distiller(palette = "Spectral") +
  guides(fill = "none") +
  theme_void()
Now we aggregate into columns and rows, taking the mean value of our variable in each case, and then assembling them into a single dataset with a variable aggregation which we can use to ‘facet’ the results in to two maps.
column_sf <- poly_sf |>
  group_by(x) |>
  summarise(z = mean(z)) |>
  mutate(aggregation = "by column")

row_sf <- poly_sf |>
  group_by(y) |>
  summarise(z = mean(z)) |>
  mutate(aggregation = "by row")

aggregated_data <- bind_rows(column_sf, row_sf)
And now we can make maps of the results. The column-wise aggregation emphasizes the gradient, while the row-wise aggregation erases it completely, since every row has a similar set of values ranging from low to high, and when these are combined each row ends up pretty much the same.
ggplot(aggregated_data) +
  geom_sf(aes(fill = z)) +
  scale_fill_distiller(palette = "Spectral") +
  guides(fill = "none") +
  facet_wrap( ~ aggregation) +
  theme_void() +
  theme(strip.text = element_text(size = 14, margin = margin(2, 0, 2, 0, "pt")))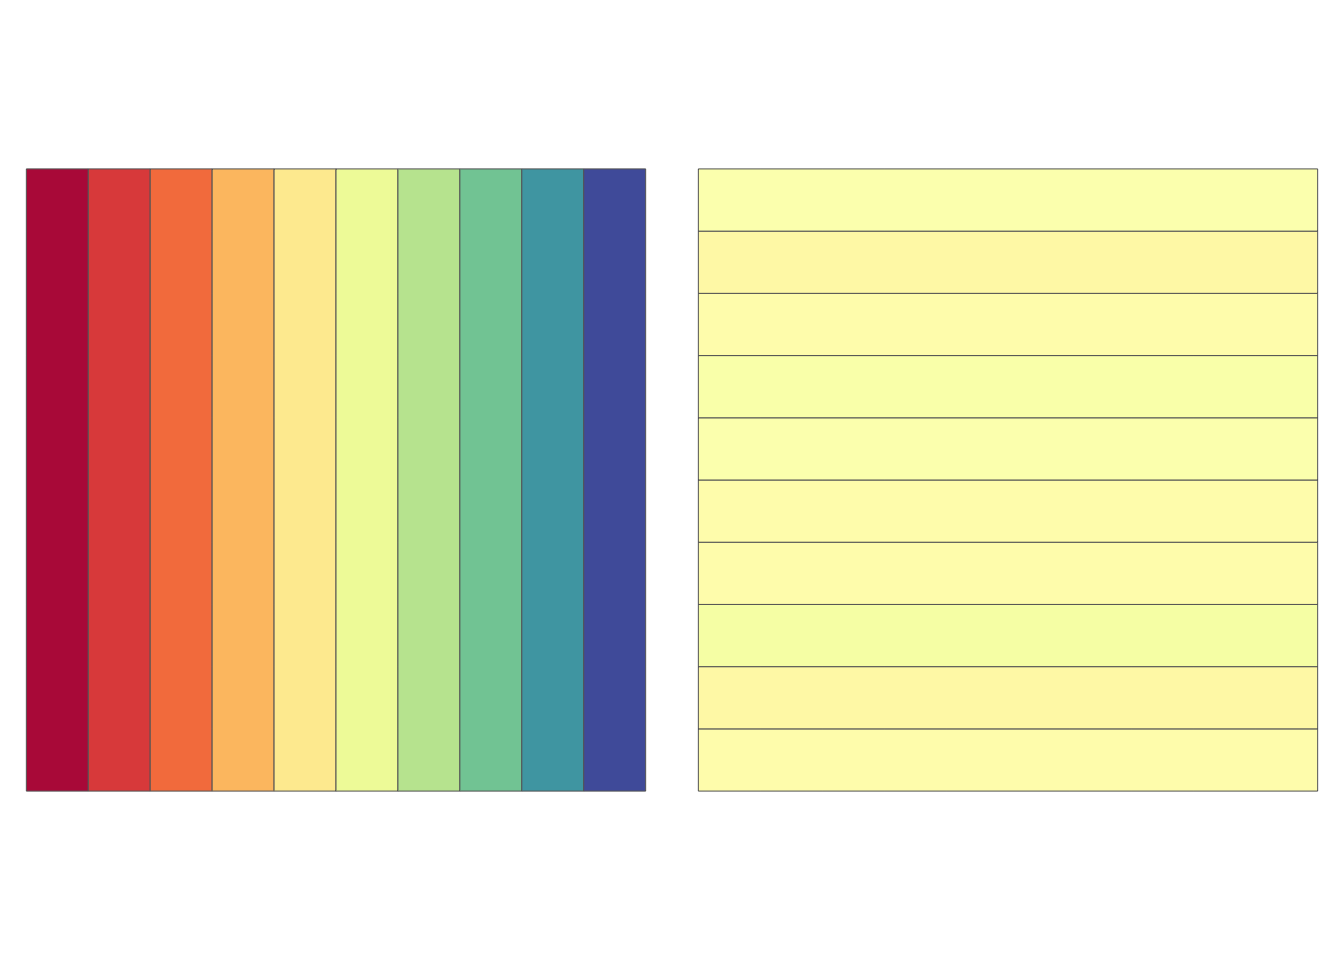
# License (MIT)
#
# Copyright (c) 2023 David O'Sullivan
#
# Permission is hereby granted, free of charge, to any person
# obtaining a copy of this software and associated documentation
# files (the "Software"), to deal in the Software without restriction,
# including without limitation the rights to use, copy, modify, merge,
# publish, distribute, sublicense, and/or sell copies of the Software,
# and to  permit persons to whom the Software is furnished to do so,
# subject to the following conditions:
#
# The above copyright notice and this permission notice shall be included
# in all copies or substantial portions of the Software.
#
# THE SOFTWARE IS PROVIDED "AS IS", WITHOUT WARRANTY OF ANY KIND, EXPRESS
# OR IMPLIED, INCLUDING BUT NOT LIMITED TO THE WARRANTIES OF MERCHANTABILITY,
# FITNESS FOR A PARTICULAR PURPOSE AND NONINFRINGEMENT. IN NO EVENT SHALL
# THE AUTHORS OR COPYRIGHT HOLDERS BE LIABLE FOR ANY CLAIM, DAMAGES OR OTHER
# LIABILITY, WHETHER IN AN ACTION OF CONTRACT, TORT OR OTHERWISE, ARISING
# FROM, OUT OF OR IN CONNECTION WITH THE SOFTWARE OR THE USE OR OTHER
# DEALINGS IN THE SOFTWARE.
© 2023-24 David O’Sullivan