Code
library(tidyr)
library(dplyr)
library(sf)
library(ggplot2)
library(ggpattern)
library(cols4all)This page produces a coloured version of Figure 5.10 which is easier to read (but may not show the same clusters).
library(tidyr)
library(dplyr)
library(sf)
library(ggplot2)
library(ggpattern)
library(cols4all)The data are as used in Luc Guillemot’s website example.
sf_demog <- st_read("sf_clustering_data.gpkg")There are some NA data which we will show as hatched areas using the ggpattern package so some work is required on that.
nas <- sf_demog |>
  st_union() |>
  st_difference(sf_demog |>
  drop_na() |>
st_union())k-means clustering in R using the base kmeans function is straightforward, but requires a non-spatial version of the dataset. We also remove the ID columns and the cluster assignment from the data (since we don’t want to do clustering and include a variable that already designates a cluster).
sf_demog <- sf_demog |>
  drop_na()

sf_demog.d <- sf_demog |>
  st_drop_geometry() |>
  select(-(1:2), -cluster)

km <- kmeans(sf_demog.d, centers = 9)
Next we append the cluster result to the original spatial dataset so we can map it.
sf_demog$k9 <- km$cluster |> as.factor()

ggplot(nas) +
  geom_sf_pattern(fill = "white", lwd = 0,
                  pattern_fill = "black", pattern_density = 0.04,
                  pattern_angle = 45, pattern_spacing = 0.012) +
  geom_sf(data = sf_demog, aes(fill = k9)) +
  scale_fill_brewer(palette = "Paired") +
  guides(fill = "none") +
  coord_sf(xlim = c(1.82e6, 1.87e6), ylim = c(6.3e5, 6.6e5)) +
  theme_void() +
  theme(panel.background = element_rect(fill = "#bbddff"))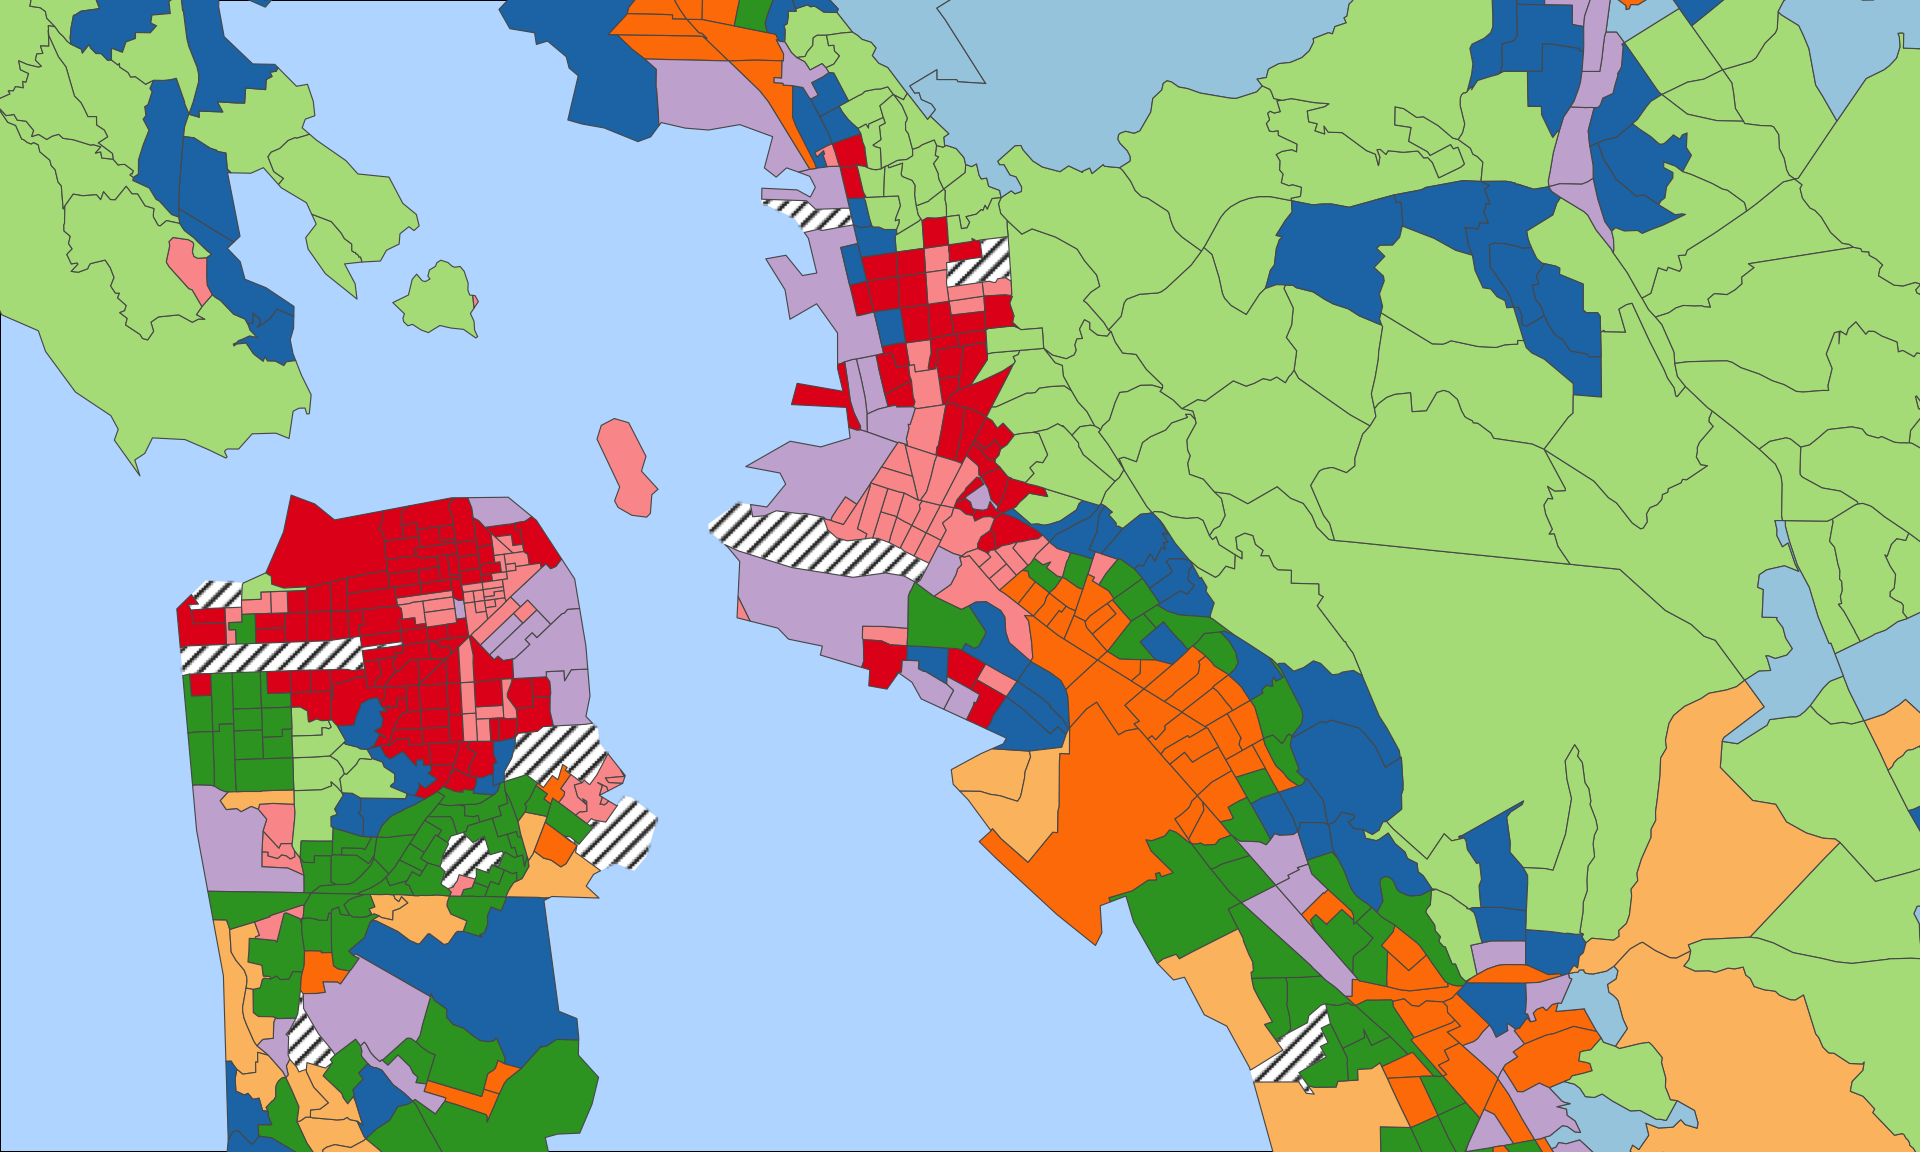
And for comparison, below is the regionalization from Luc Guillemot’s more complex clustering method. The colours don’t match up (they are just colours!) but you can see that the overall regionalisation result is broadly similar, even though we have requested only 9 clusters from the k-means analysis.
ggplot(nas) +
  geom_sf_pattern(fill = "white", lwd = 0,
                  pattern_fill = "black", pattern_density = 0.04,
                  pattern_angle = 45, pattern_spacing = 0.012) +
  geom_sf(data = sf_demog, aes(fill = as.factor(cluster))) +
  scale_fill_discrete_c4a_cat(palette = "20") +
  guides(fill = "none") +
  coord_sf(xlim = c(1.82e6, 1.87e6), ylim = c(6.3e5, 6.6e5)) +
  theme_void() +
  theme(panel.background = element_rect(fill = "#bbddff"))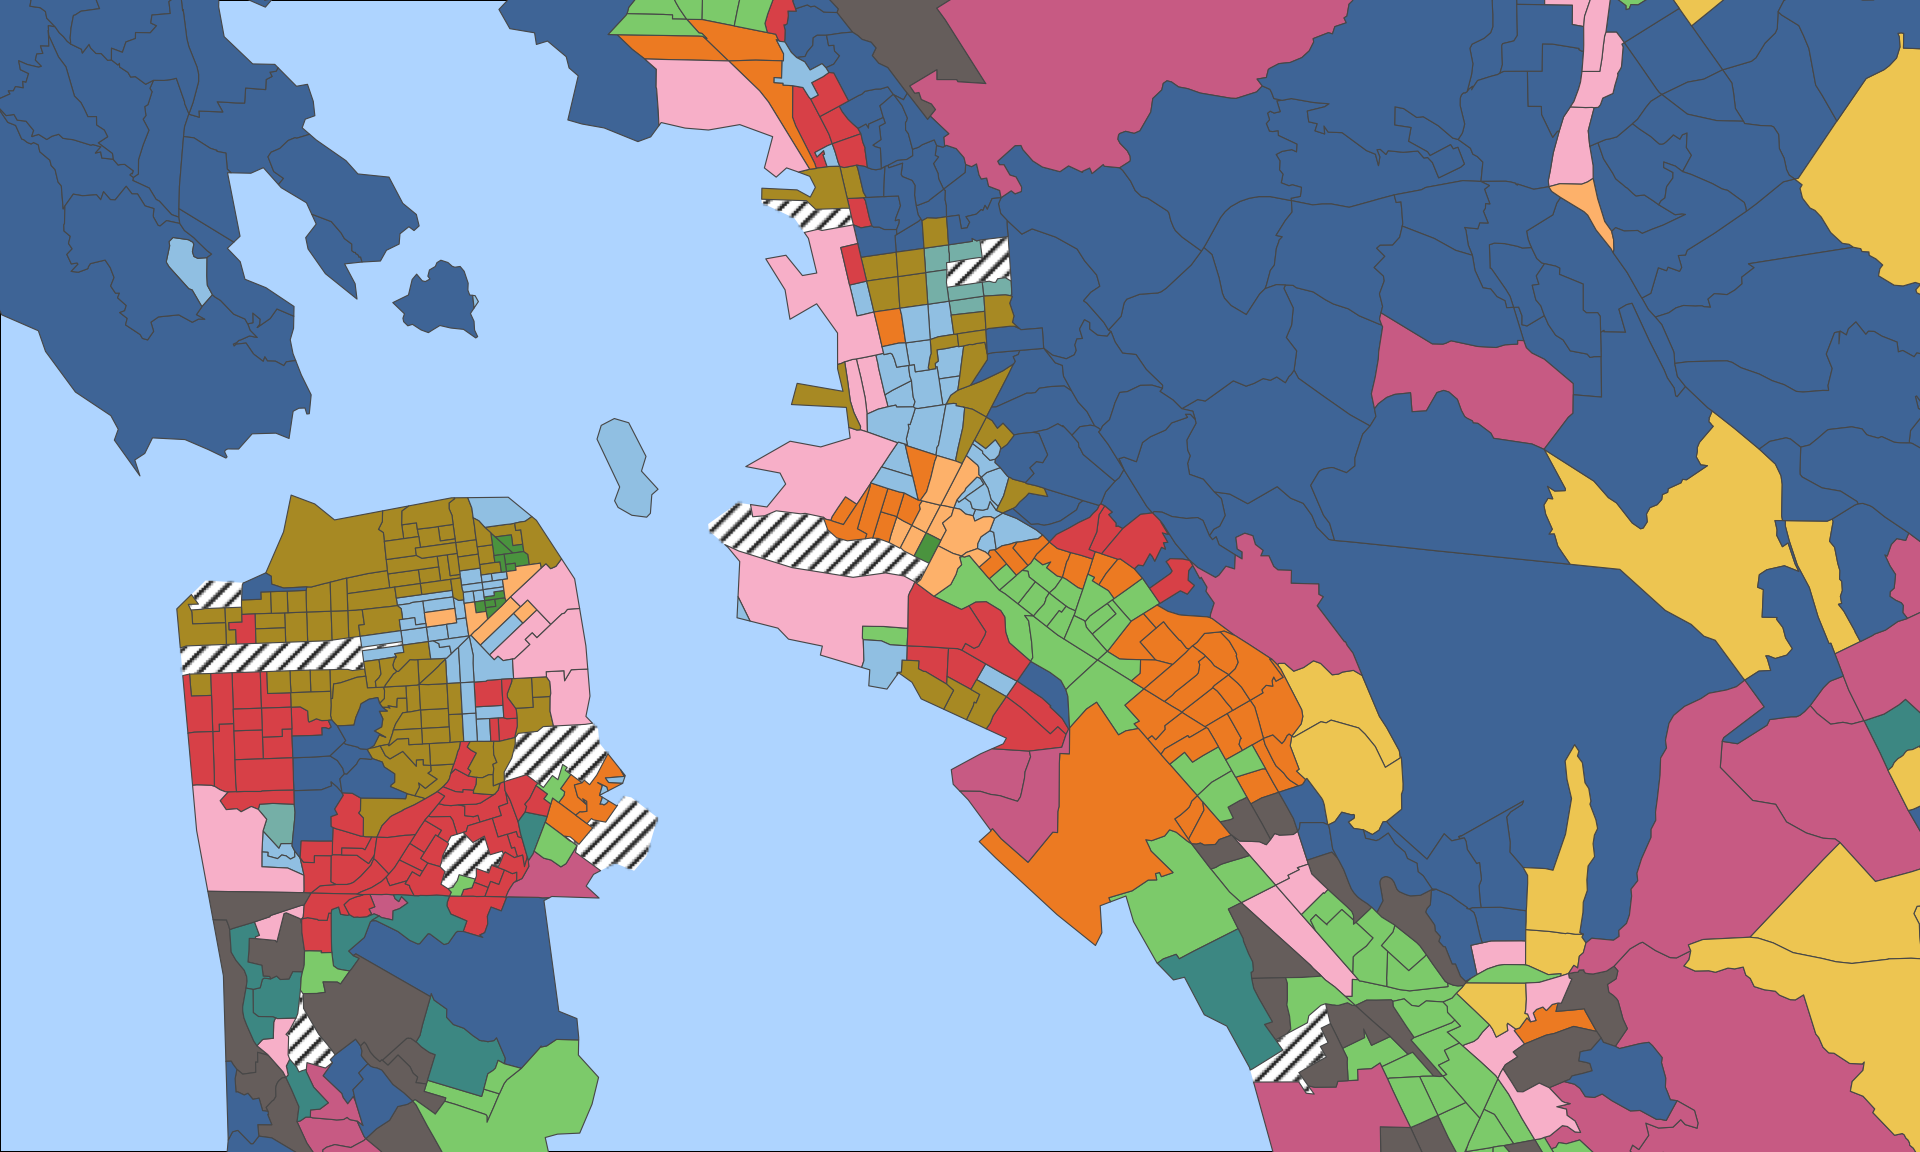
# License (MIT)
#
# Copyright (c) 2023 David O'Sullivan
#
# Permission is hereby granted, free of charge, to any person
# obtaining a copy of this software and associated documentation
# files (the "Software"), to deal in the Software without restriction,
# including without limitation the rights to use, copy, modify, merge,
# publish, distribute, sublicense, and/or sell copies of the Software,
# and to  permit persons to whom the Software is furnished to do so,
# subject to the following conditions:
#
# The above copyright notice and this permission notice shall be included
# in all copies or substantial portions of the Software.
#
# THE SOFTWARE IS PROVIDED "AS IS", WITHOUT WARRANTY OF ANY KIND, EXPRESS
# OR IMPLIED, INCLUDING BUT NOT LIMITED TO THE WARRANTIES OF MERCHANTABILITY,
# FITNESS FOR A PARTICULAR PURPOSE AND NONINFRINGEMENT. IN NO EVENT SHALL
# THE AUTHORS OR COPYRIGHT HOLDERS BE LIABLE FOR ANY CLAIM, DAMAGES OR OTHER
# LIABILITY, WHETHER IN AN ACTION OF CONTRACT, TORT OR OTHERWISE, ARISING
# FROM, OUT OF OR IN CONNECTION WITH THE SOFTWARE OR THE USE OR OTHER
# DEALINGS IN THE SOFTWARE.
© 2023-24 David O’Sullivan