Code
library(sf)
library(tmap)
library(dplyr)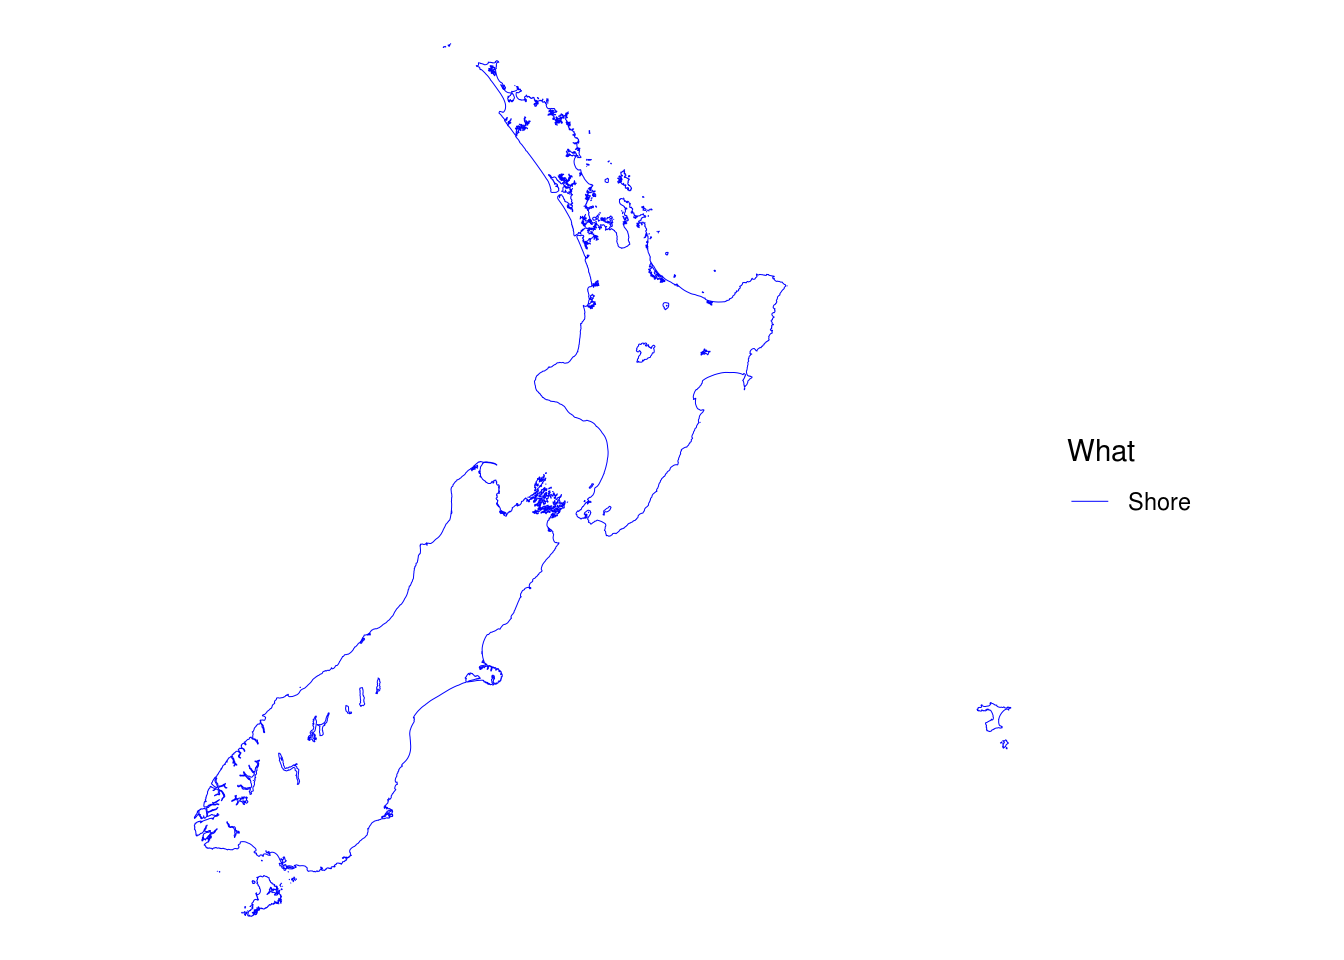
library(ggplot2)A map with lines.
library(sf)
library(tmap)
library(dplyr)
library(ggplot2)nz <- st_read("data/nz.gpkg") %>%
st_cast("MULTILINESTRING") %>%
mutate(What = "Shore",
What = as.factor(What))But first… a rabbithole.
Something this map got me looking at a bit more closely than ever before was exactly what is going on with the linewidth setting in ggplot2, which, like a lot of things you’ve learned by osmosis, rather than systematically, doesn’t seem that important until it does.
The obvious fact is that lwd = 0.5 in tmap and linewidth = 0.5 in ggplot2 do not yield the same result. Turns out… it’s complicated. tmap uses 0.75 points, and ggplot2 uses ~0.75 millimetres.
Wait, wut? 0.75 pts and approximately 0.75 mm?! Yes, you read that correctly.
To be fair to tmap, it’s using the R graphics standard, which is that lwd is specified in pixels, which is notionally 1/96 inch, as laid down by CSS. This is ‘device dependent’ and when it comes to getting plots out of R and into image file formats can lead to all kinds of headaches, but that’s another story. A point is 1/72 inch (ever since Adobe made it so), so lwd = 1 gives you nominal line widths of 0.75 points in tmap.
Meanwhile, according to the ggplot2 documentation (RTFM, eh?)
Due to a historical error, the unit of linewidth is roughly 0.75 mm. Making it exactly 1 mm would change a very large number of existing plots, so we’re stuck with this mistake.
They say nothing more on the matter. Presumably, it’s something to do with that 1/72 vs 1/96 thing just noted, and perhaps the approximately is due to TeX’s use of a point being 1/72.27 inches, which is apparently more historically accurate, and was the approximation settled upon, because it is palindromic! OK… well maybe not really that last bit.
Anyway, the magic number 72.27 is buried in the ggplot2 code, where the conversion factor 72.27 / 25.4 is baked in. I was led to this information by this stackoverflow post.
The upshot of all this? To get the same line widths in ggplot2 as in tmap multiply by 25.4 / 72.27. Simple really!
tmaptm_shape(nz) +
tm_lines(
col = "What",
col.scale = tm_scale_categorical(
values = c("blue")),
lwd = 0.5) +
tm_layout(
frame = FALSE,
legend.frame = FALSE,
legend.outside = TRUE)
ggplot2ggplot(nz) +
geom_sf(aes(colour = What), linewidth = 0.5 * 25.4 / 72.27) +
scale_colour_manual(values = c("blue")) +
theme_void()