Code
library(sf)
library(tmap)
library(tidyr)
library(dplyr)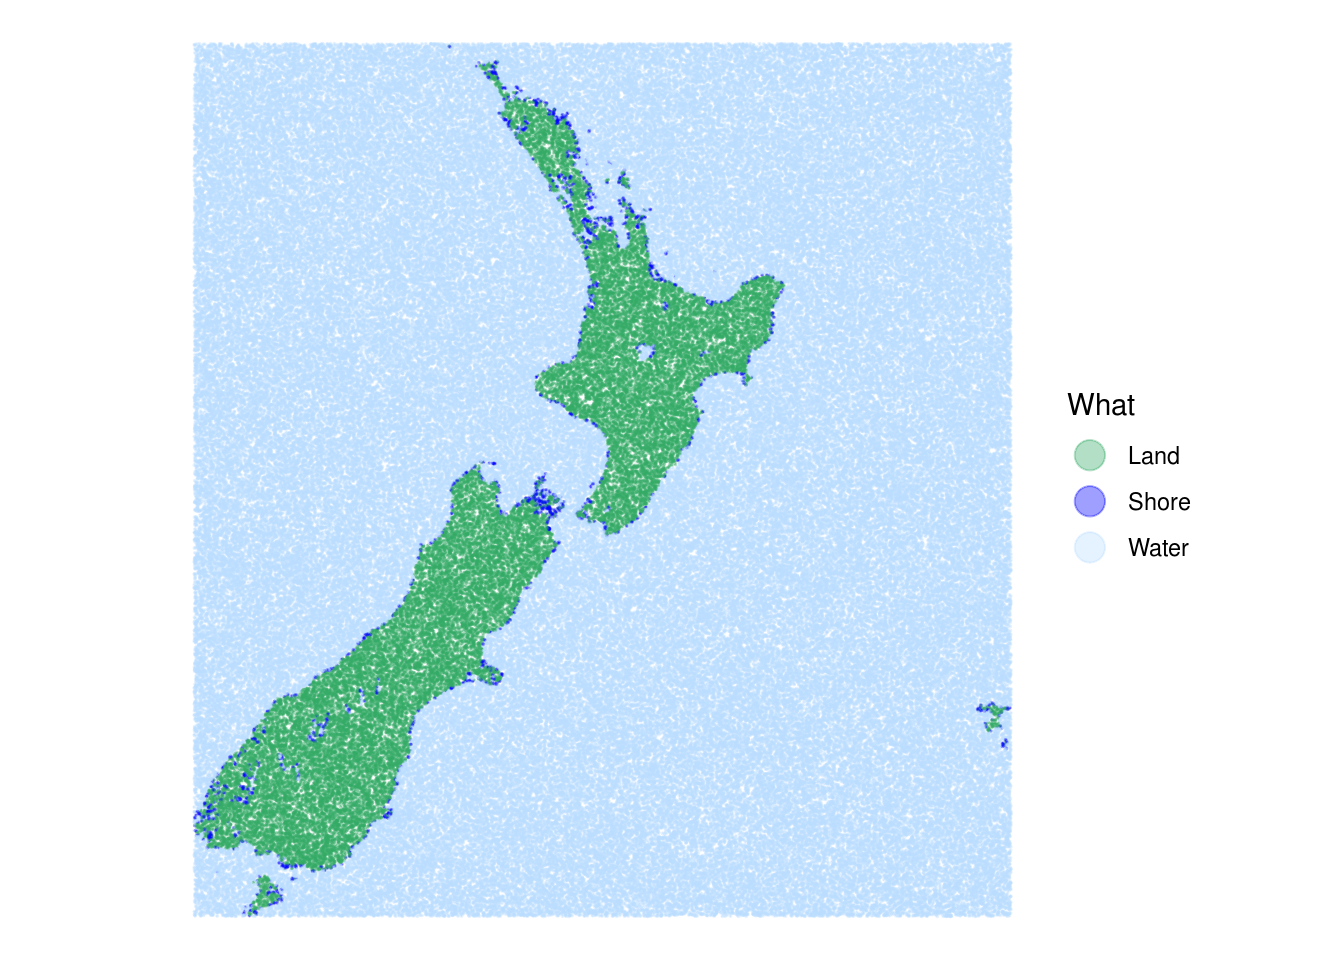
library(ggplot2)A map with points.
The first three themes (points, lines, areas) all work with the same data. I’m making a meta-point about the somewhat arbitrary nature of geometries in spatial data (a polygon is after all conceputalised as a point set).
library(sf)
library(tmap)
library(tidyr)
library(dplyr)
library(ggplot2)Ironically, of the three, the points maps was the fiddliest to make from the data wrangling perspective, because of course, the source data is a polygon dataset.
w <- 500

nz <- st_read("data/nz.gpkg") %>%
  mutate(Land = TRUE)

bb <- nz %>%
  st_bbox() %>%
  st_as_sfc() %>%
  st_as_sf(crs = st_crs(nz)) %>%
  st_buffer(w, nQuadSegs = 1)

shore <- nz %>%
  st_cast("MULTILINESTRING") %>%
  st_cast("LINESTRING") %>%
  st_buffer(w) %>%
  st_as_sfc() %>%
  st_as_sf(crs = st_crs(nz)) %>%
  mutate(Shore = TRUE)

land <- nz %>%
  st_union() %>%
  st_buffer(w)

water <- bb %>%
  st_difference(land) %>%
  mutate(Water = TRUE)

pts <- bb %>%
  st_sample(250000) %>%
  st_sf() %>%
  st_as_sf(crs = st_crs(nz)) %>%
  st_join(water) %>%
  st_join(nz) %>%
  st_join(shore) %>%
  mutate(Water = replace_na(Water, FALSE),
         Land  = replace_na(Land, FALSE),
         Shore = replace_na(Shore, FALSE),
         What = NA) %>%
  slice(sample(1:n()))

pts[pts$Water, "What"] <- "Water"
pts[pts$Land, "What"] <- "Land"
pts[pts$Shore, "What"] <- "Shore"

pts <- pts %>%
  mutate(What = as.factor(What)) %>%
filter(!is.na(What))tmaptmap v4’s slightly verbose format is apparent here. There is no obvious way to make legend elements larger hence more readable.
tm_shape(pts) +
  tm_dots(
    fill = "What",
    fill.scale = tm_scale_categorical(
      values = c("#33aa6660", "#0000ff60", "#bbddff60"),
      levels = c("Land", "Shore", "Water")),
    size = 0.05) +
  tm_layout(
    frame = FALSE,
    legend.frame = FALSE,
    legend.outside = TRUE)
ggplot2In ggplot2 you can override the default symbol size in the colour legend, although it’s not exactly an obvious snippet of code! The default legend position in ggplot2 is not my preference, but I can’t be bothered to move it.
ggplot(pts) +
  geom_sf(aes(colour = What), size = 0.025) +
  scale_colour_manual(values = c("#33aa6660", "#0000ff60", "#bbddff60")) +
  guides(colour = guide_legend(override.aes = list(size = 5))) +
  theme_void()