21 Raster
Pixels please.
What is a pixel anyway? A snare and a delusion is what. See:
Fisher P. 1997. The pixel: A snare and a delusion. International Journal of Remote Sensing, 18(3), 679–685.
So these aren’t pixels, but 200 metre squares, made using the weavingspace tools I’ve been working on.
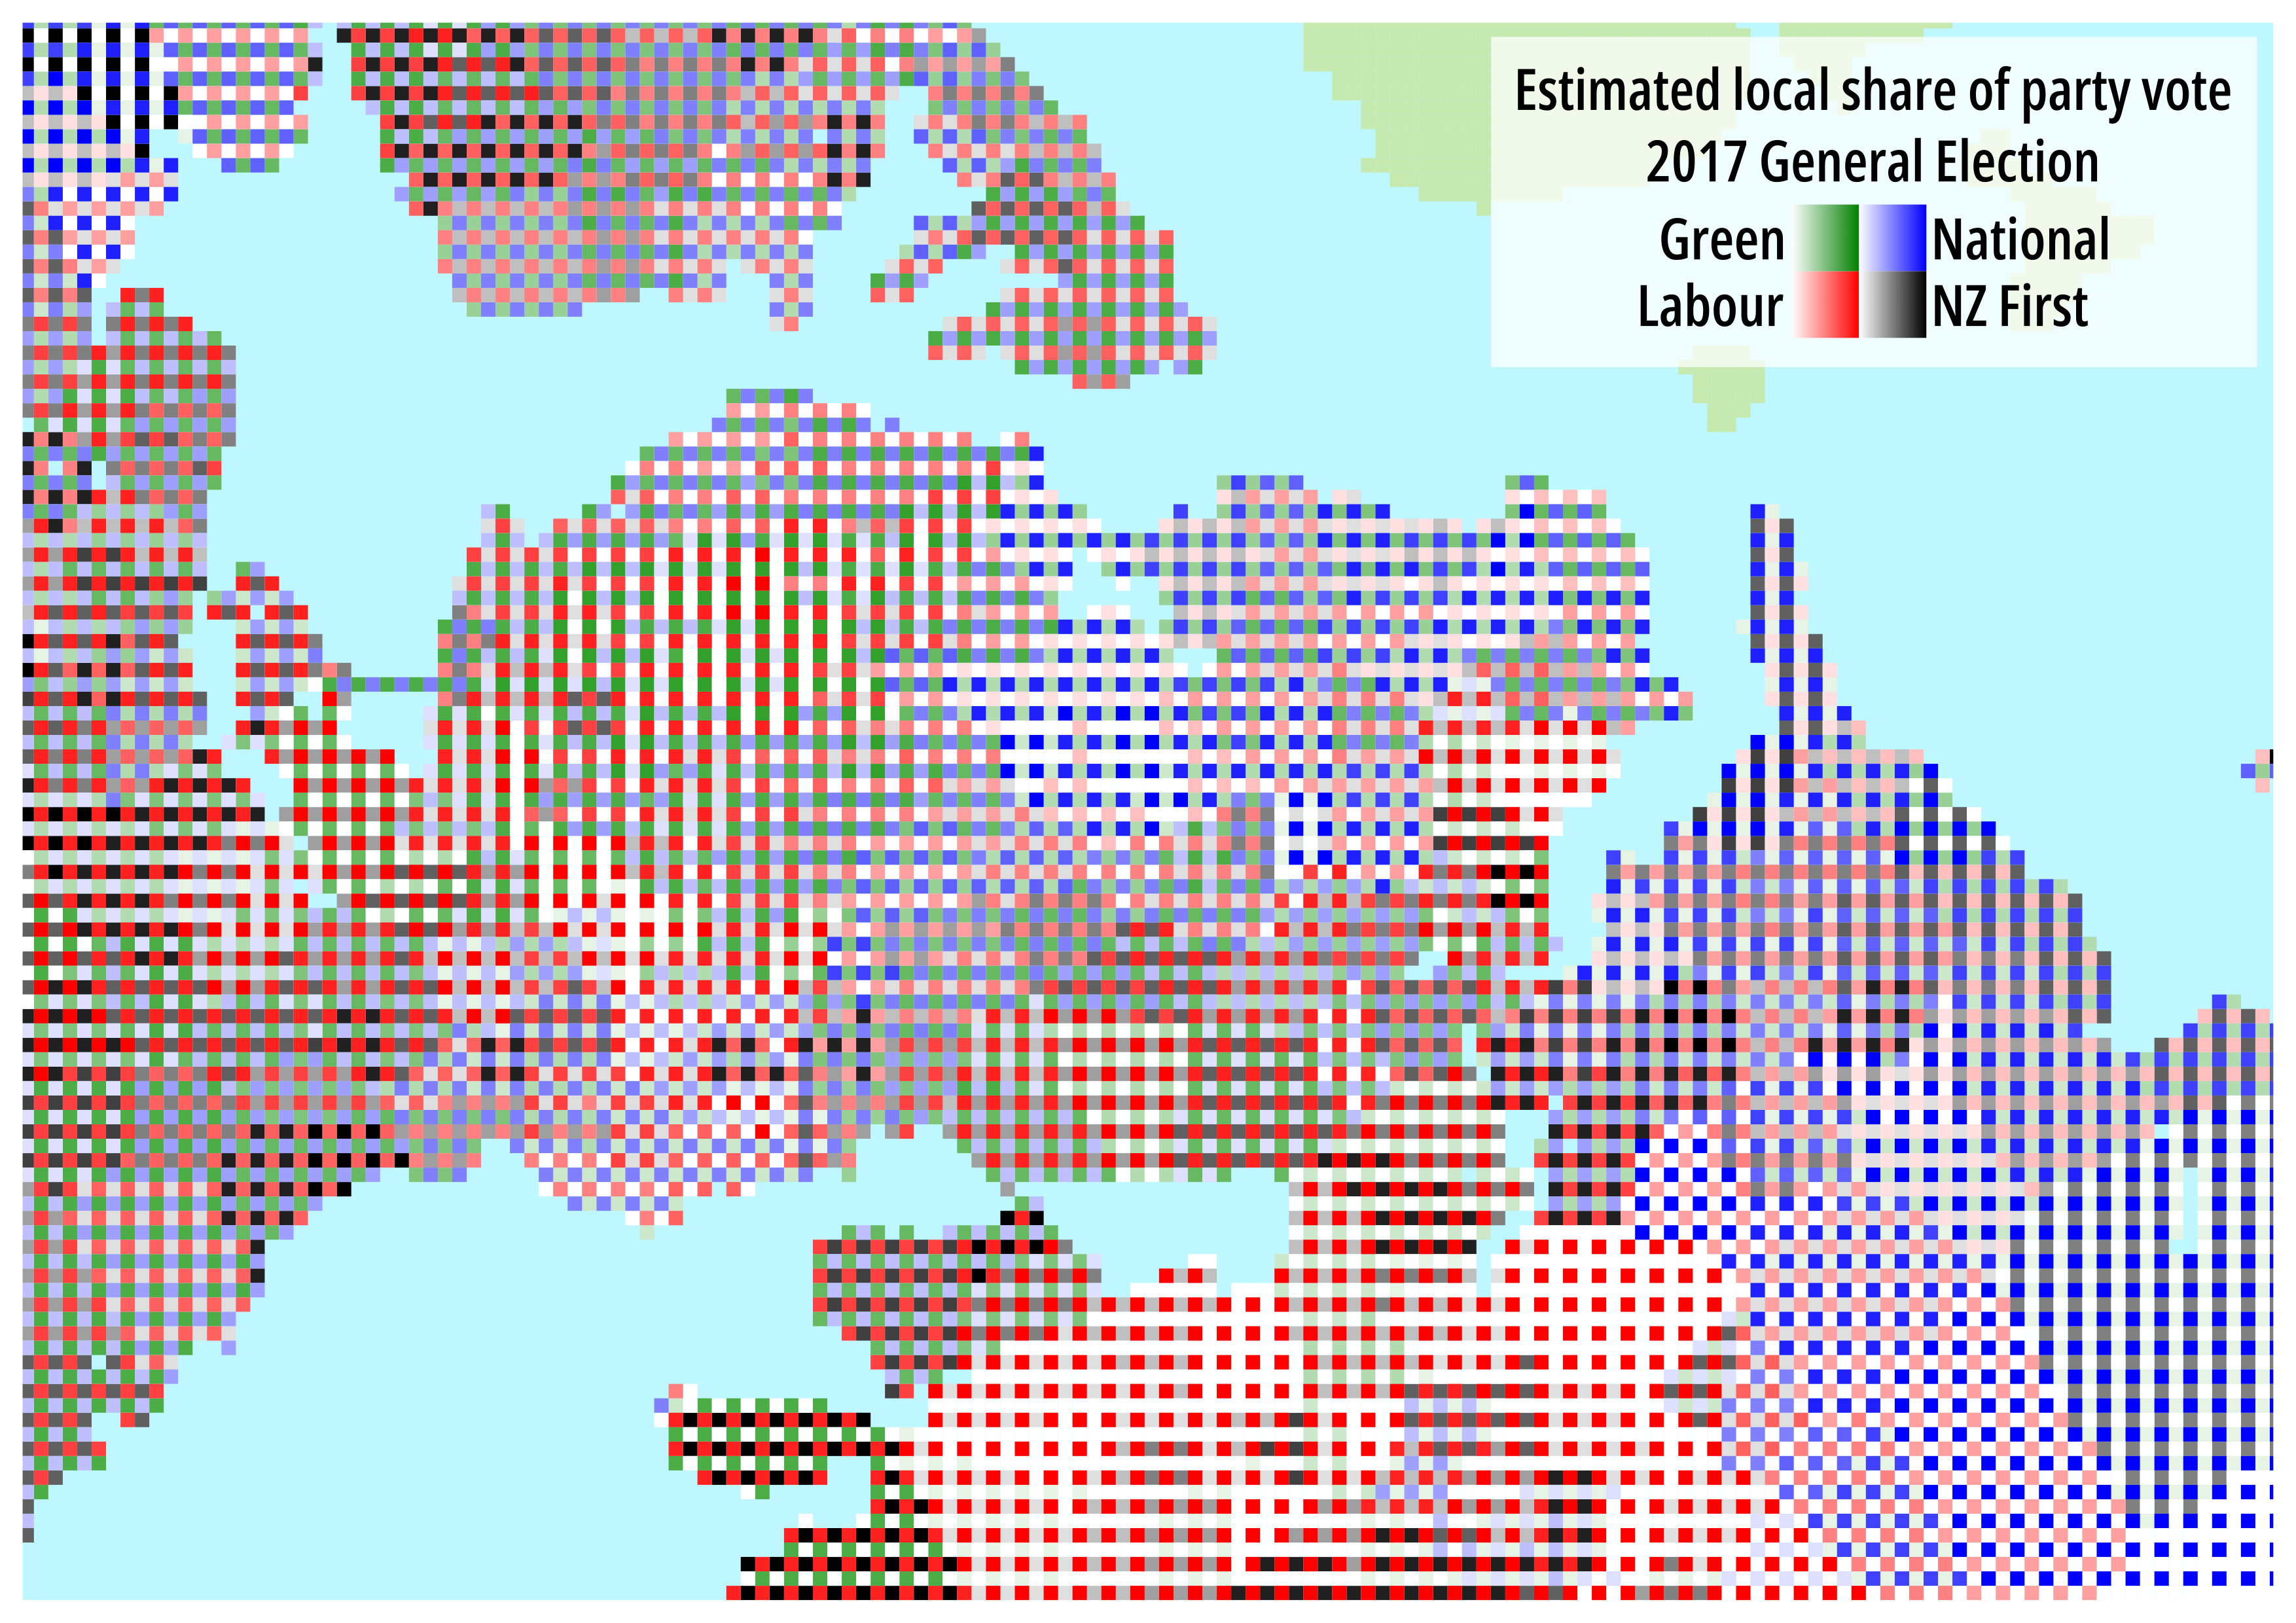
There was far too much data preparation here to spend time on in this page, but briefly, the data were derived by determining the share of the party vote of the four leading parties in the 2017 New Zealand general election, by polling place, based on the data available here, albeit as cleaned up and available here. Why 2017? Well 2023 data are not quite available at the moment, and the 2020 result was kind of uninteresting (a Labour landslide).
Polling places are at point locations, so I Voronoi-ed those and that gave me area data. Of course people are free to vote anywhere, and many votes cast in urban areas will be near places of work, not where people live, but it’s the best quick approximation we can do.
So that gives %share of the vote for the National, Labour, Green and NZ First parties (the four largest parties in that election), roughly mapped.
I then tiled it with a basic weave pattern, and separately symbolised the four distinct elements in the tiling in the ‘traditional’ colours of each party.
There’s a lot more could be said about what I mean by a basic weave pattern, and I could have broken with the ‘raster’ prompt and made all kinds of other patterns using the weavingspace API, as shown below.

But in this case, given the fairly distinctive colour ramps for each party, and also the fact that if one party did well in an area, others did worse, the ability to distinguish variables in this map is contingent on the data, more so than it might usually be, and so I can respect the ‘raster’ prompt and show proper ‘pixels’ (even if they are strictly vector squares).
I did put Labour and National, and also the Greens and NZ First in diagonal opposition to one another, as these votes tend to be mutually exclusive, while there are places where Labour-Green votes and National-NZ First, or even Labour-NZ First voting aligns (National-Green alignment is rare). There are also ‘checkerboard’ Labour-National places, where neither of the two smaller parties did particularly well.
The effect we are hoping for with these tiled/woven maps is the deliberate design of texture/pattern that allows distinctive clustering in multivariate data to be visualized in a single map view.