Code
library(ggplot2)
library(dplyr)
library(sf)
library(tmap)The greatest of the datasets. Remember to give credit.
Some have claimed that Wellington has more cafés per capita than any other city. I can’t speak to that, but it certainly has a few as borne out by the OpenStreetMap data.
I thought I’d see how it was adding custom symbols to a map. In short, it’s not as easy as I’d like.
library(ggplot2)
library(dplyr)
library(sf)
library(tmap)xlims <- c(1.746e6, 1.751e6)
ylims <- c(5.426e6, 5.431e6)
bb <- tmaptools::bb(xlim = xlims, ylim = ylims) %>%
st_as_sfc() %>%
st_as_sf(crs = 2193)
wellington <- st_read("data/wellington-ta.gpkg")
cafes <- st_read("data/cafes-in-nz.gpkg") %>%
st_filter(bb) %>%
select(geom)
roads <- st_read("data/welly-rds.gpkg")
icon_file <- "data/coffee.png"
cafes$icon <- icon_filetmapTo use a PNG image as a symbol, you have to first pass it to the tmap_icons function. It took me a while to figure this out because in its current in-process state the documentation of this feature is not all that clear. The lwd = 0 setting is to suppress a box that appears unasked for around the symbols.
coffee_cup <- tmap_icons(icon_file)

tm_shape(wellington, bbox = bb) +
  tm_fill(fill = "#cccccc") +
  tm_shape(roads) +
  tm_lines(col = "white") +
  tm_shape(cafes) +
  tm_symbols(shape = coffee_cup, size = 0.35, lwd = 0) +
  tm_layout(legend.show = FALSE, bg.color = "#66ccff",
            inner.margins = rep(0, 4)) +
  tm_scalebar() +
  tm_credits(maptiles::get_credit("OpenStreetMap"),
    position = tm_pos_out(cell.h = "center", cell.v = "bottom",
                          pos.h = "right", pos.v = "top"))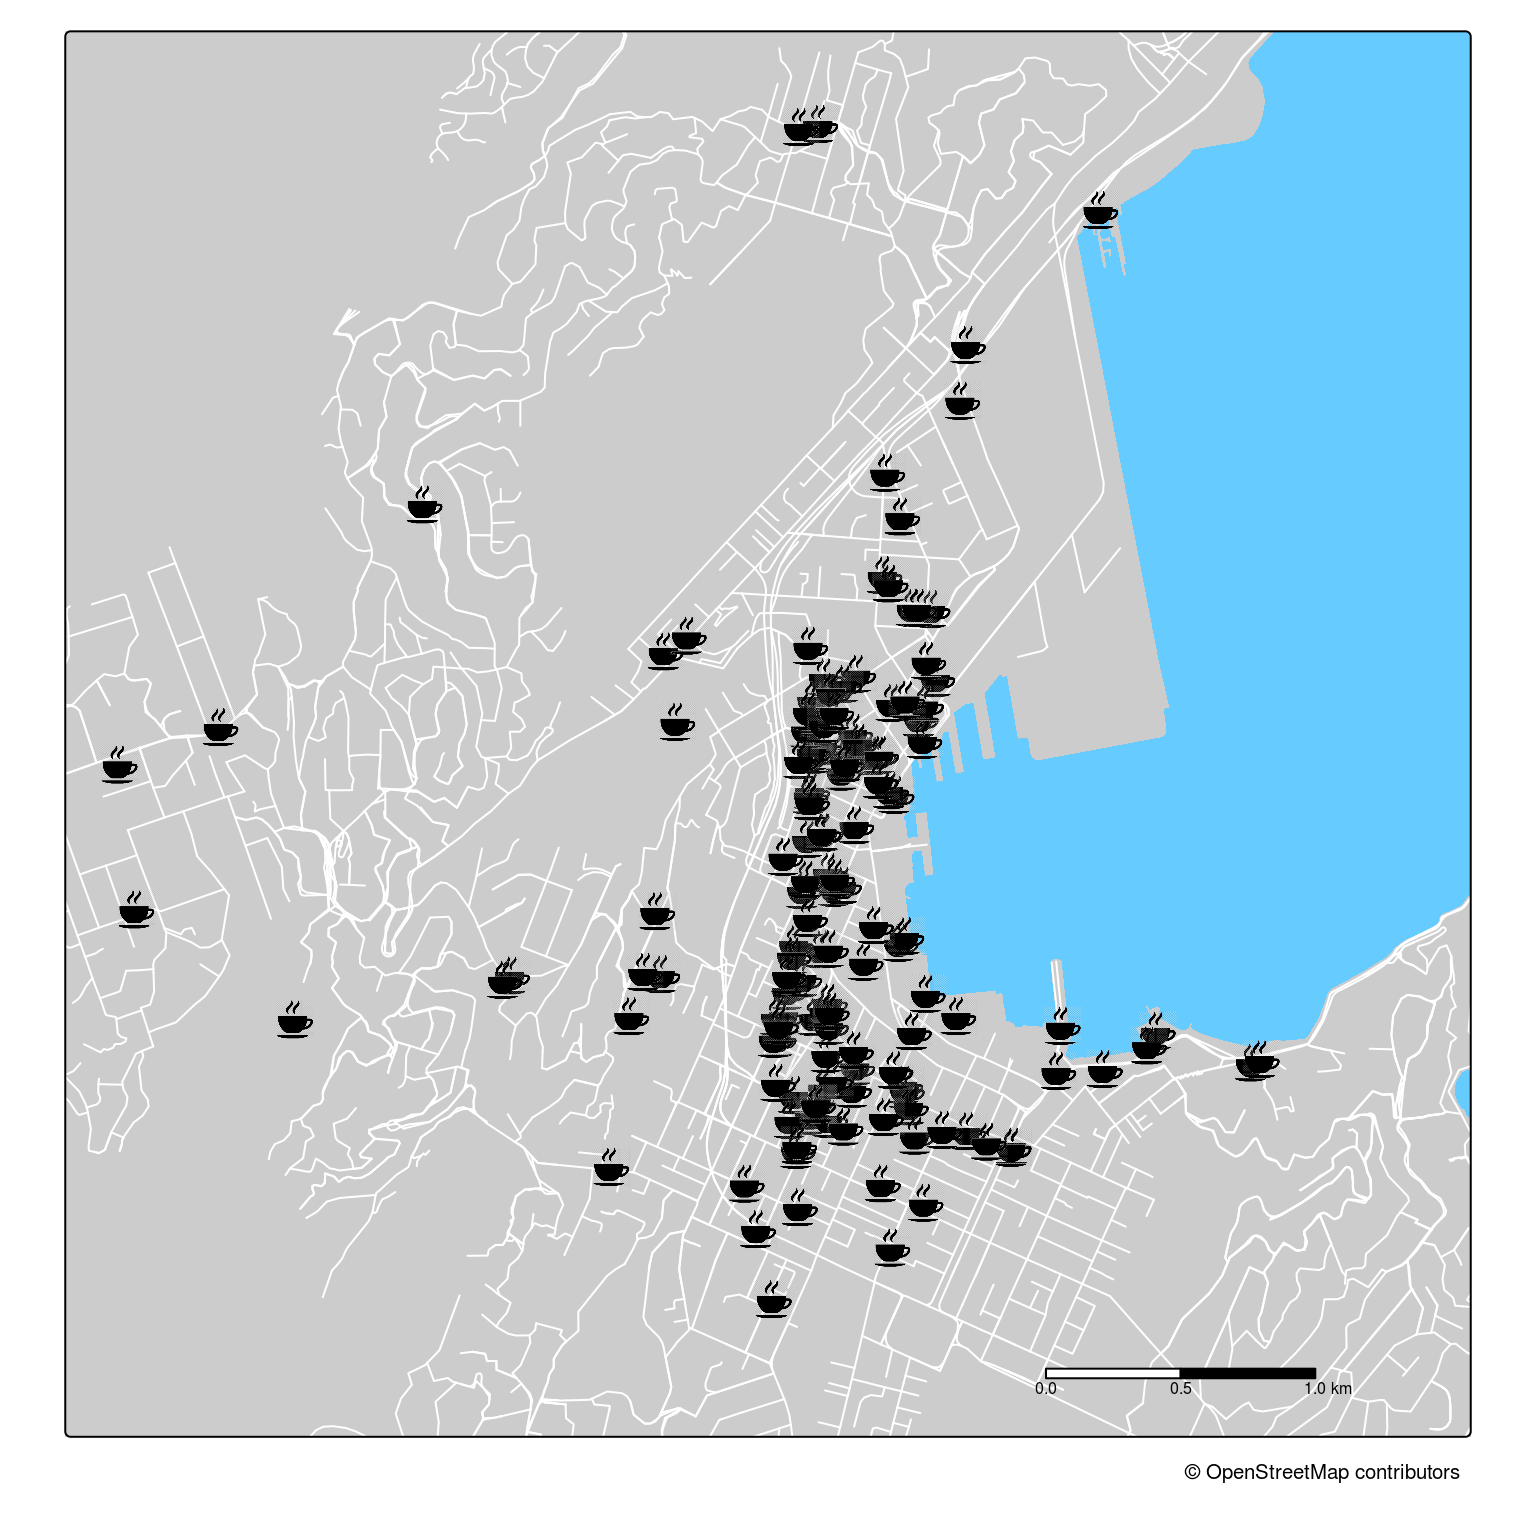
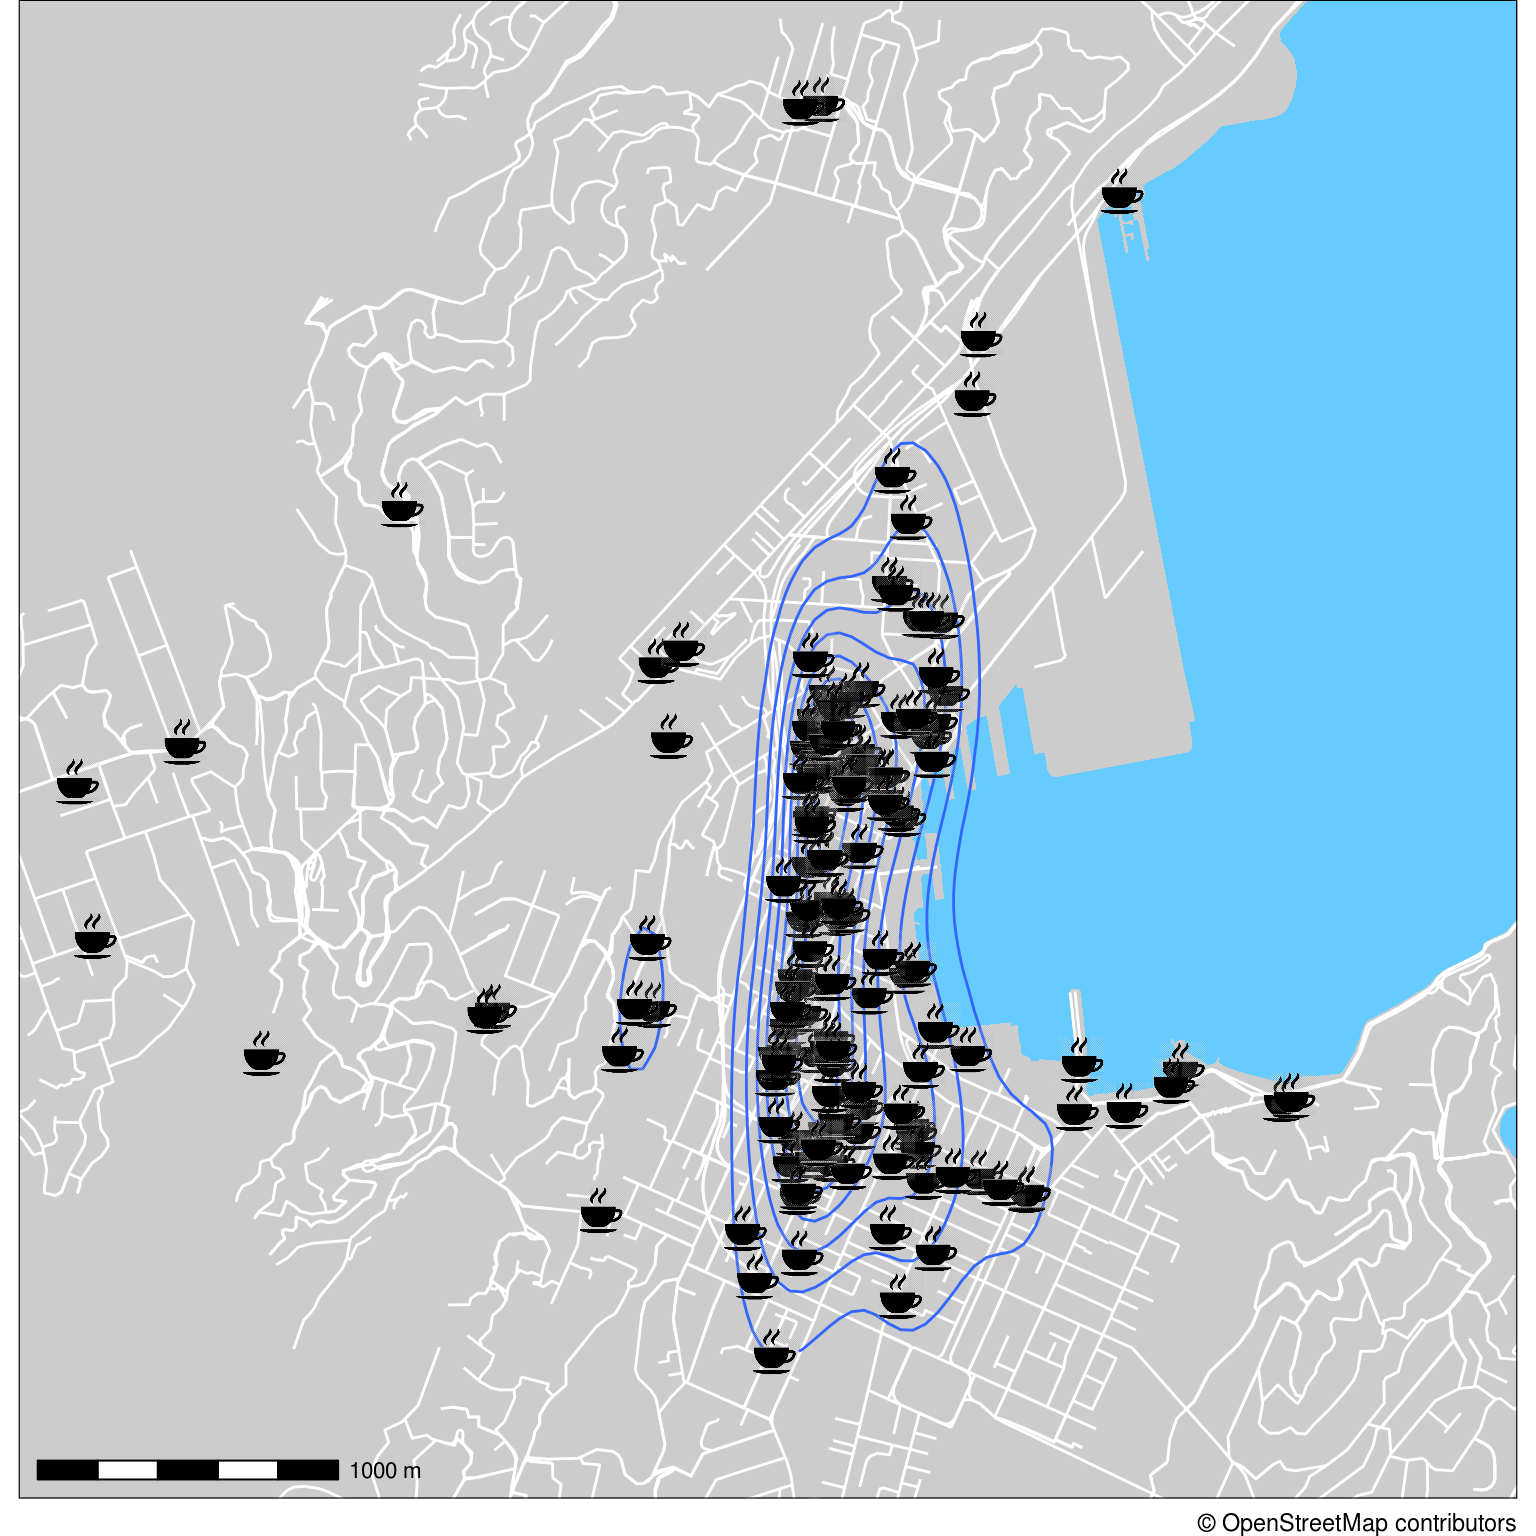
ggplot2It’s kind of fun to use ggplot2’s geom_density2d just to emphasise the bizarrely large number of cafés. To use images as a symbol we need the ggimage package.
library(ggimage)
library(ggspatial)

xy <- cafes %>%
  st_coordinates() %>%
  as_tibble()

ggplot(wellington) +
  geom_sf(fill = "#cccccc", linewidth = 0) +
  geom_sf(data = roads, colour = "white") +
  stat_density2d(data = xy, aes(x = X, y = Y)) +
  geom_image(data = xy, aes(x = X, y = Y, image = icon_file),
             size = 0.03) +
  coord_sf(xlim = xlims, ylim = ylims, expand = FALSE) +
  annotation_scale() +
  labs(caption = maptiles::get_credit("OpenStreetMap")) +
  theme_void() +
  theme(panel.background = element_rect(fill = "#66ccff"),
        panel.border = element_rect(fill = NA, colour = "black"))